Policy Distribution component
72h Stability and 4h Performance Tests of Distribution
Common Setup
The common setup for performance and stability tests is now automated - being carried out by a script in- testsuites/run-sc3-test.sh.
Clone the policy-distribution repo to access the test scripts
git clone https://gerrit.onap.org/r/policy/distribution
The following common steps are carried out by the scripts
Updates the repo package lists for apt
Installs Java 17 open jdk
Installs docker
Installs docker-compose
Retrieves version information in environment variables from th release info file
Builds relevant images including the pdp simulator
Triggers docker compose to bring up containers required for the testing
Installs jmeter
Installs visualvm (and starts it in a GUI environment)
Configures permissions for monitoring
Starts jstatd
Waits for containers to come up
Runs either stability or performance tests for a specified duration depending on the arguments specified
For example, the below runs performance tests for 2 hours. Start from the root directory of policy distribution
cd testsuites
./run-s3p-test.sh performance 7200
Note
The containers on this docker-compose are running with HTTP configuration. For HTTPS, ports and configurations will need to be changed, as well certificates and keys must be generated for security.
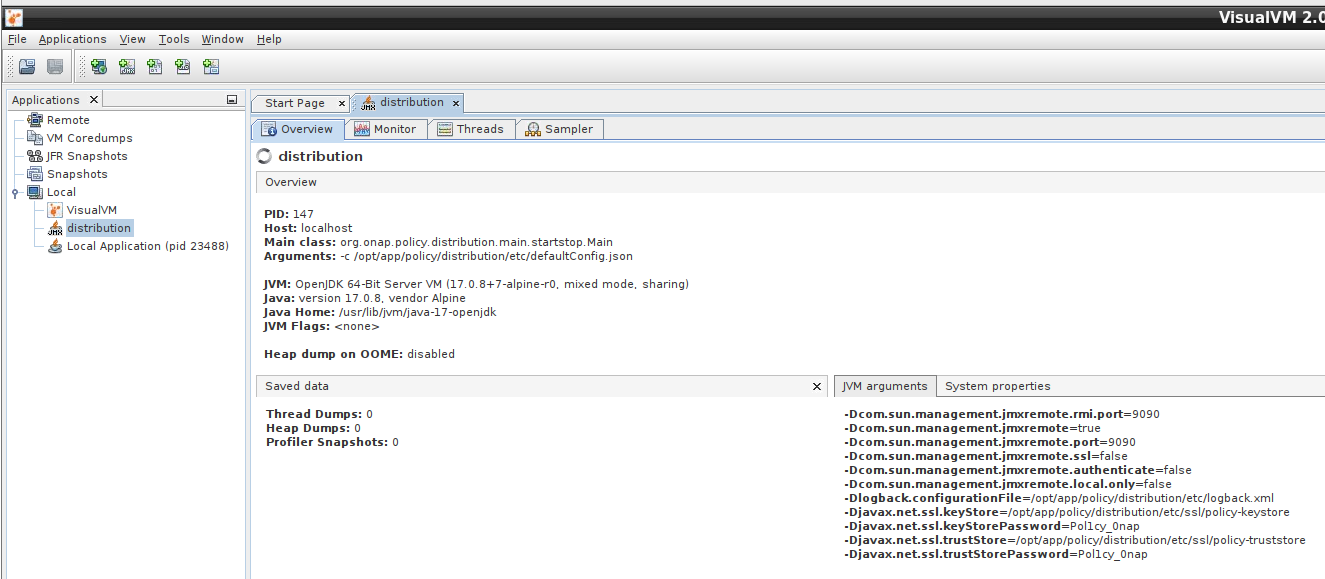
The script will load up the visualvm GUI on your virtual machine. You will need to manually connect it to the distribution JMX port.
Connect to Distribution JMX Port.
On the visualvm toolbar, click on “Add JMX Connection”
Enter localhost as the IP address and Port 9090. This is the JMX port exposed by the distribution container
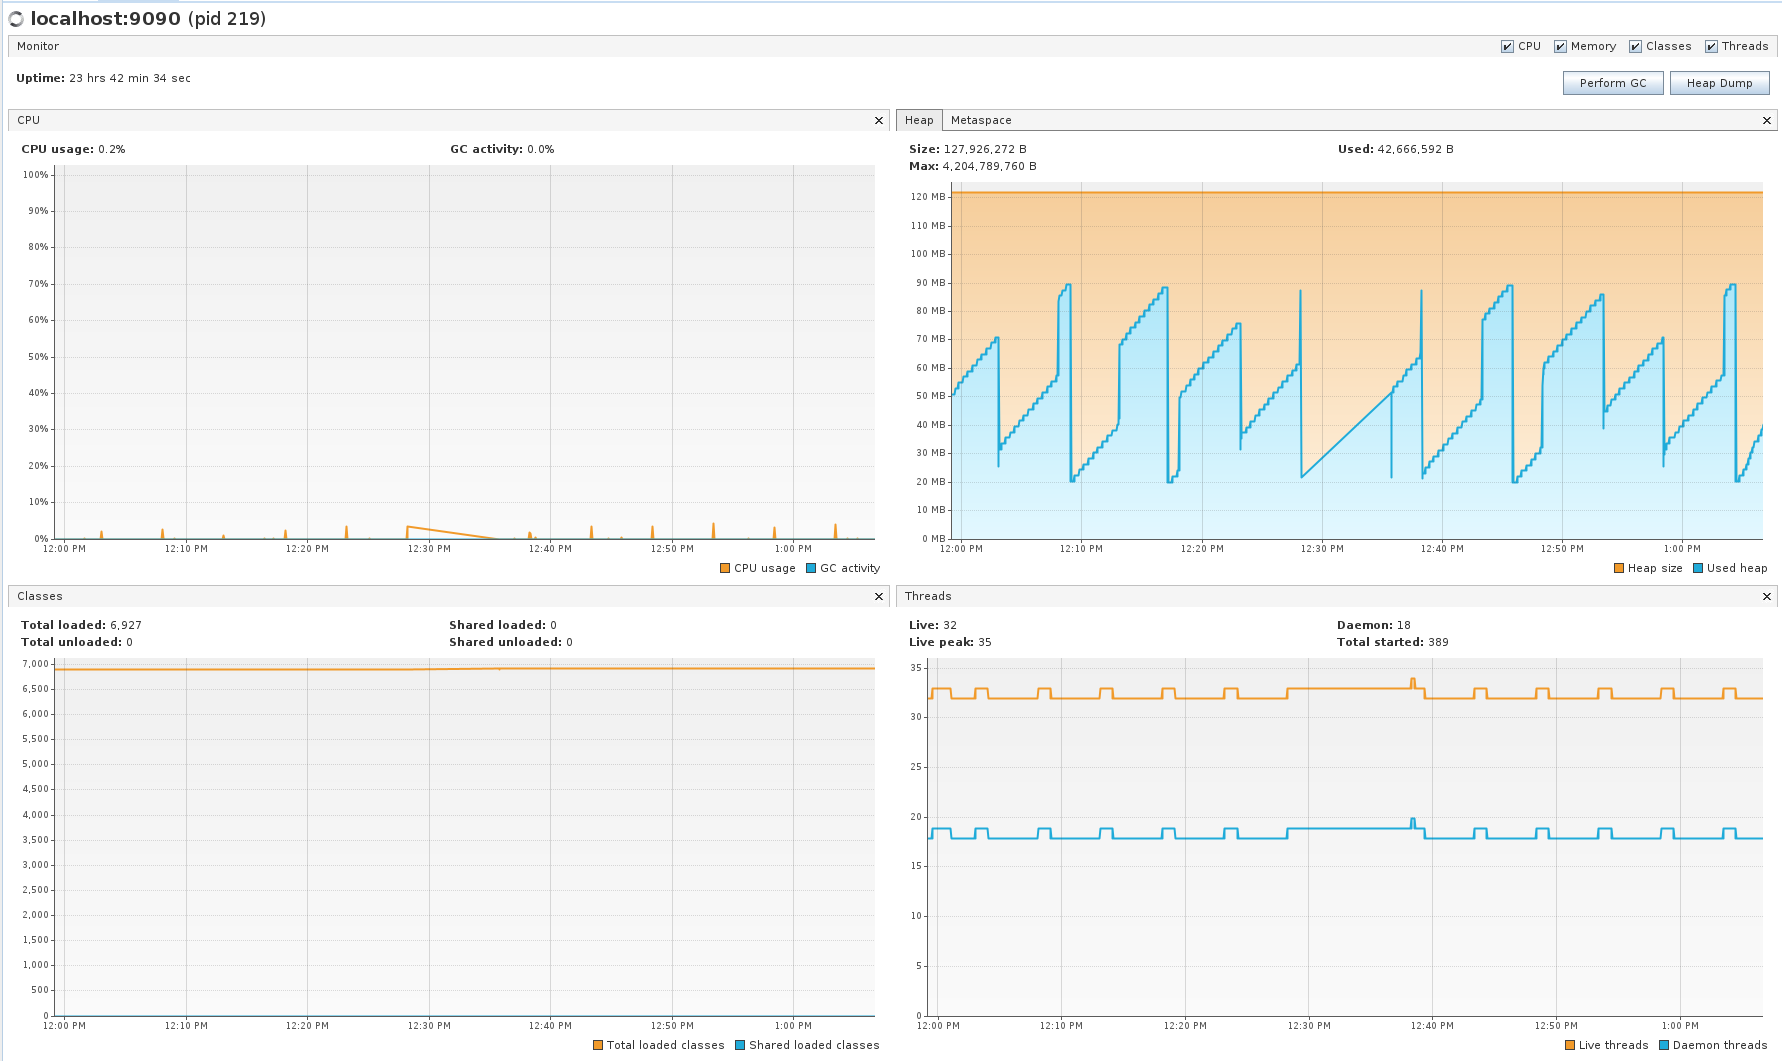
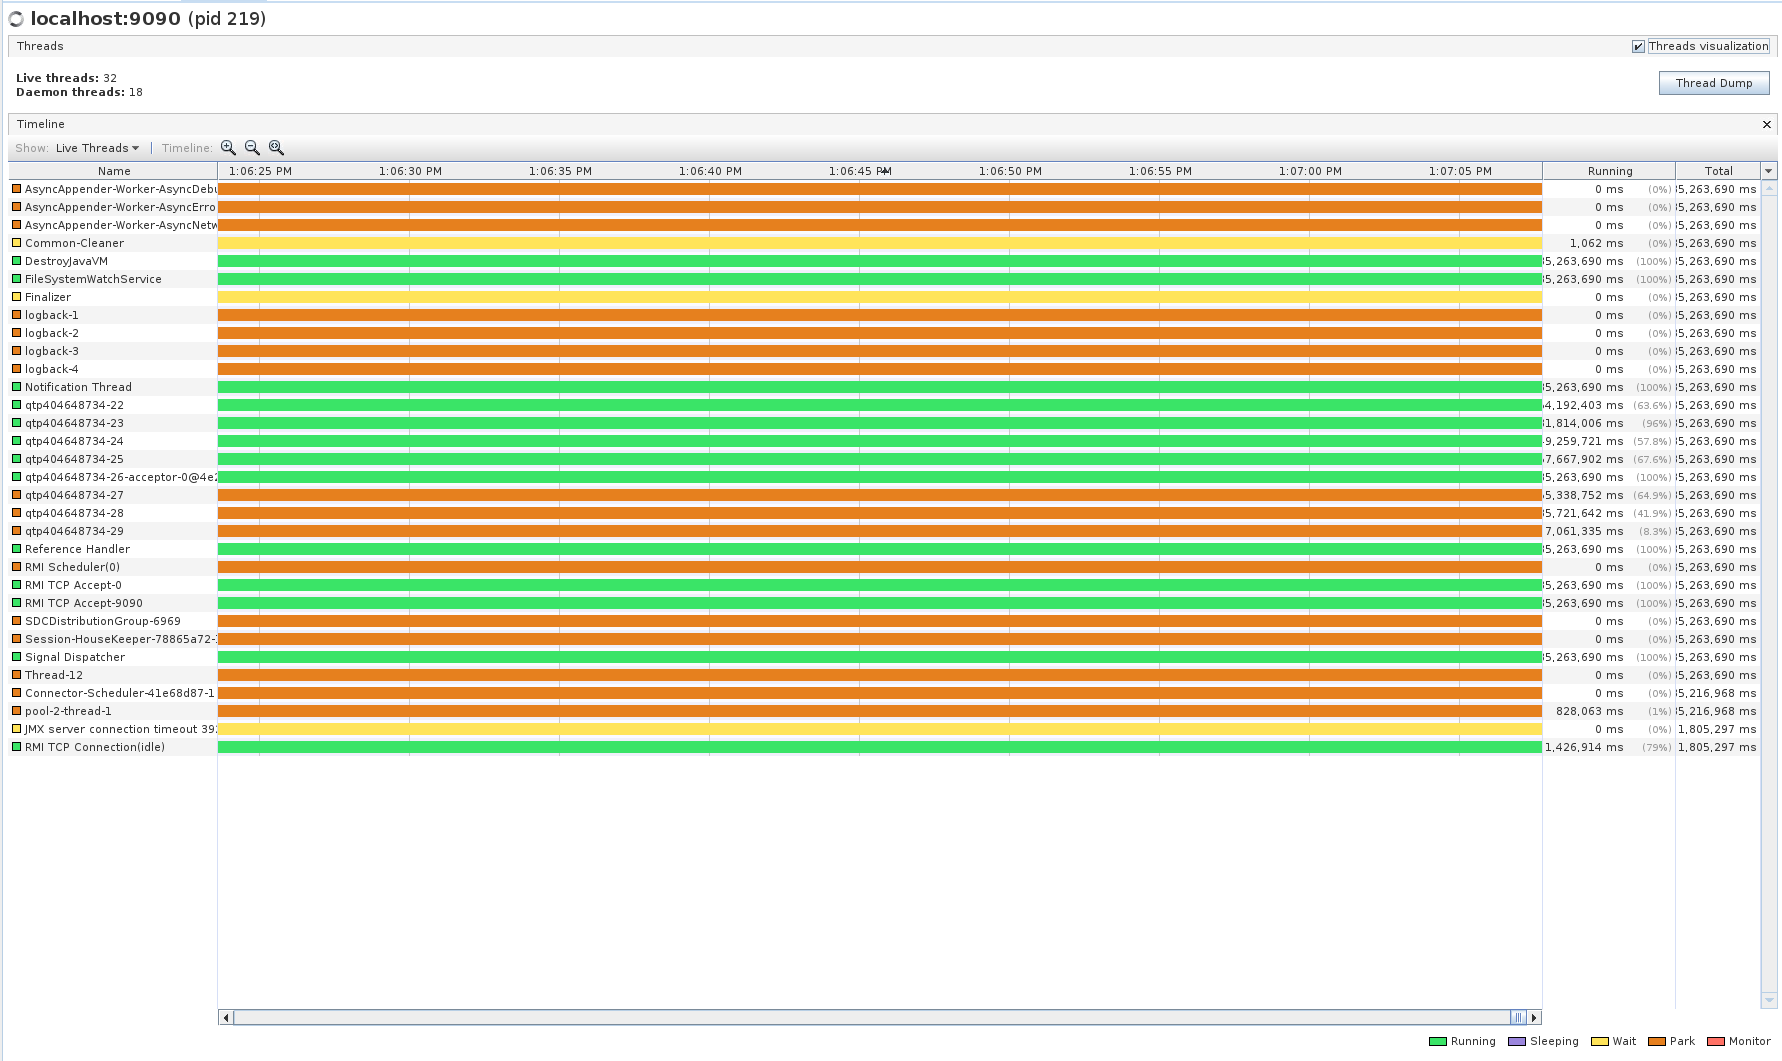
Double click on the newly added nodes under “Local” to start monitoring CPU, Memory & GC.
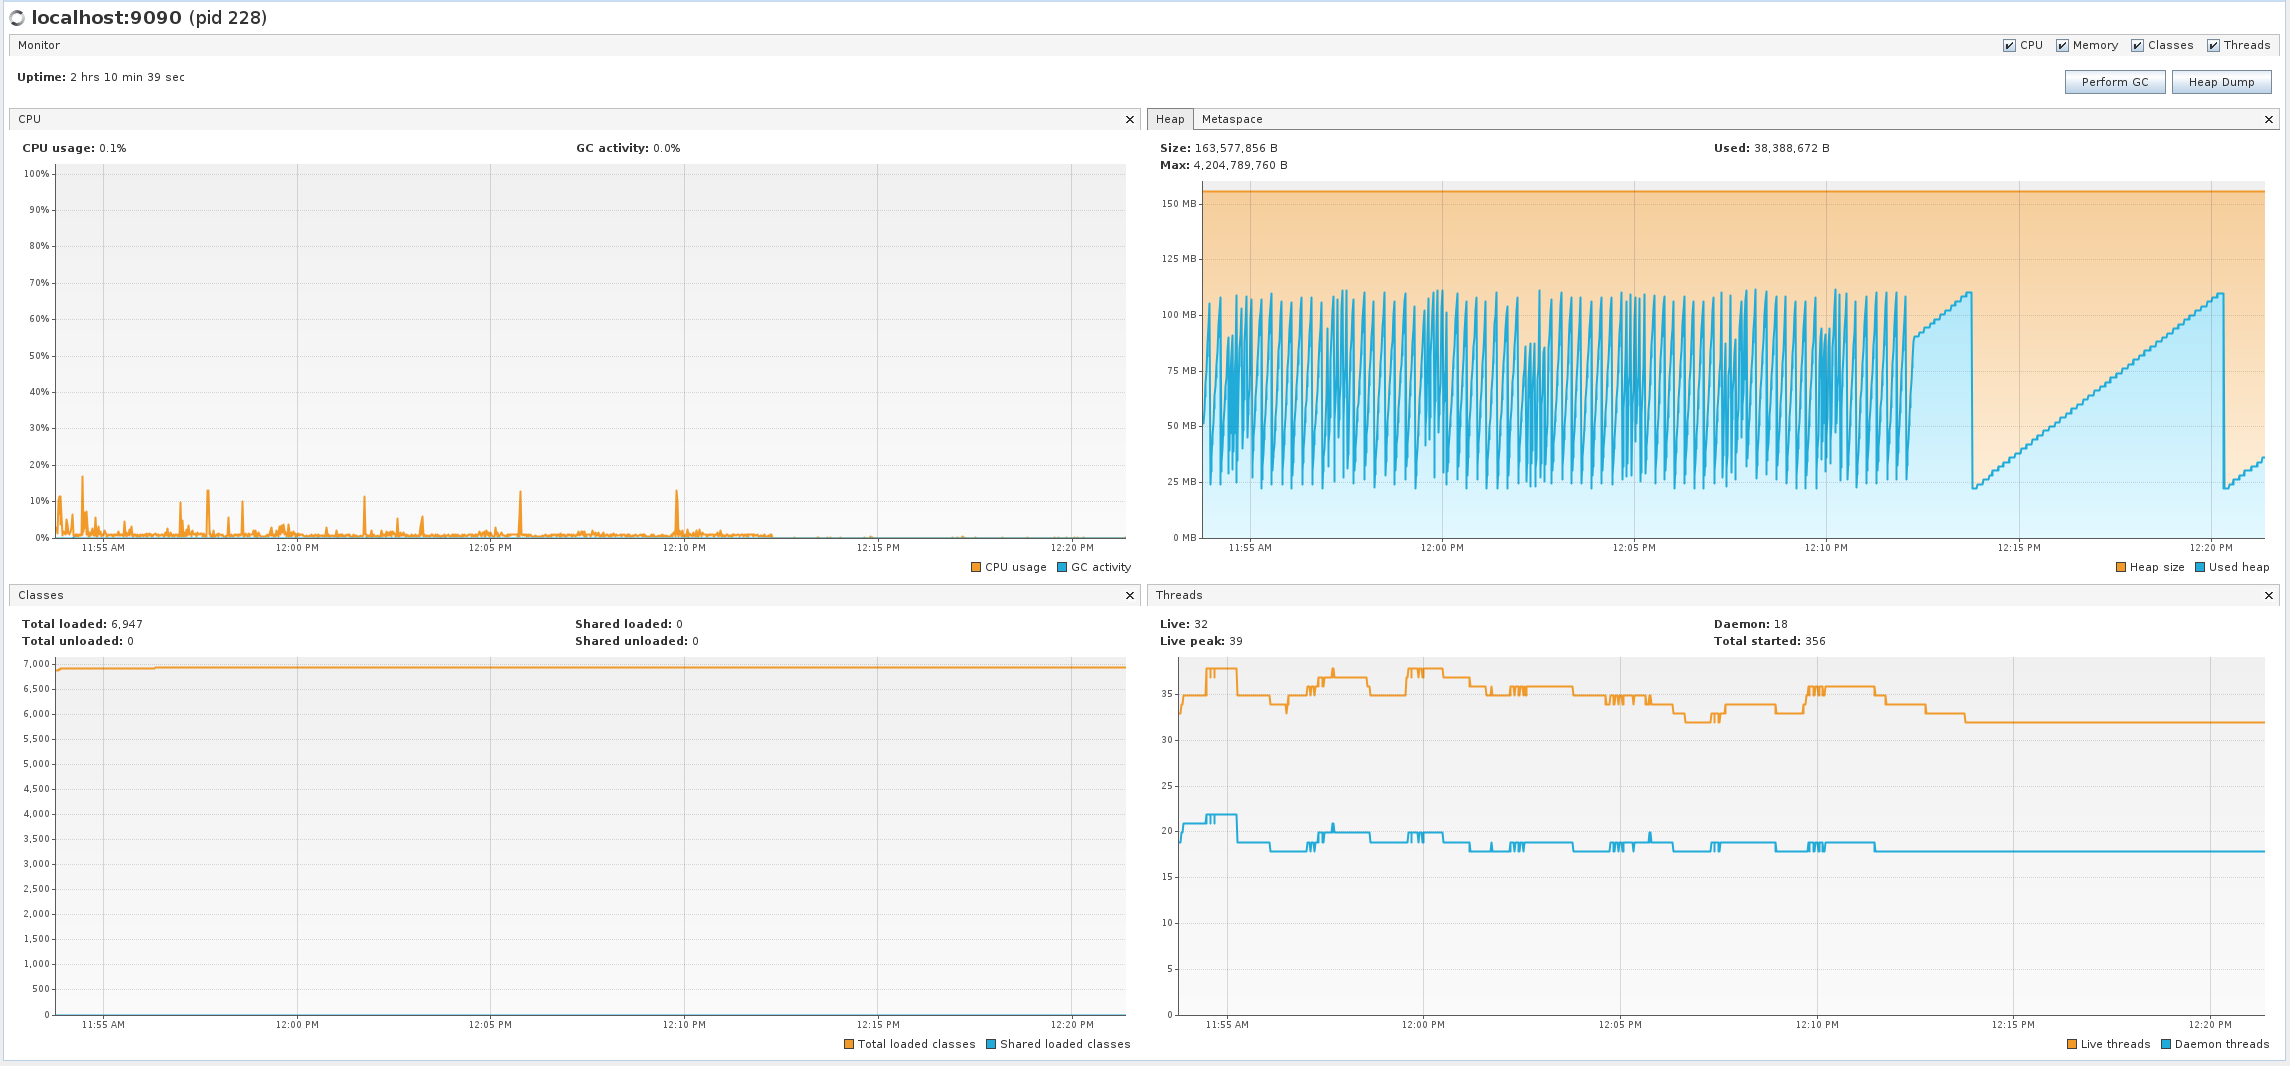
Example Screenshot of visualVM
Teardown Docker
Once the testing is finished, you can tear down the docker setup from ./testsuites with:
docker-compose -f stability/src/main/resources/setup/docker-compose.yml down
Stability Test of Policy Distribution
Introduction
The 72 hour Stability Test for policy distribution has the goal of introducing a steady flow of transactions initiated from a test client server running JMeter. The policy distribution is configured with a special FileSystemReception plugin to monitor a local directory for newly added csar files to be processed by itself. The input CSAR will be added/removed by the test client (JMeter) and the result will be pulled from the backend (PAP and PolicyAPI) by the test client (JMeter).
The test will be performed in an environment where Jmeter will continuously add/remove a test csar into the special directory where policy distribution is monitoring and will then get the processed results from PAP and PolicyAPI to verify the successful deployment of the policy. The policy will then be undeployed and the test will loop continuously until 72 hours have elapsed.
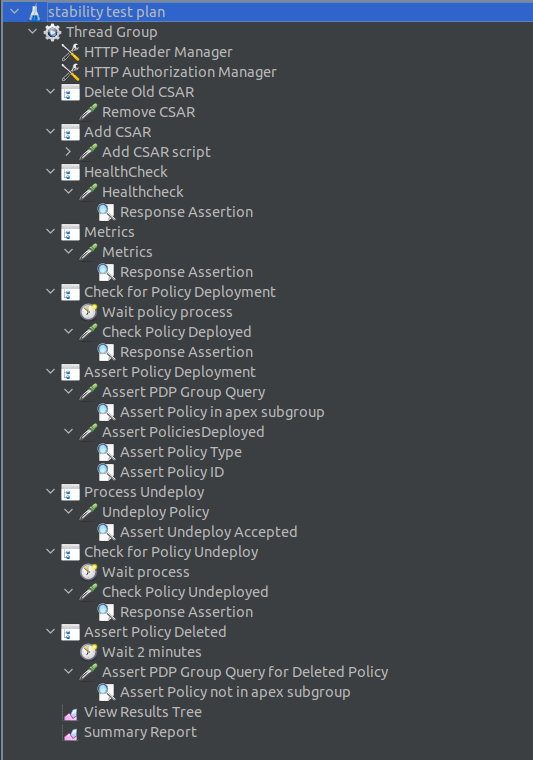
Test Plan Sequence
The 72h stability test will run the following steps sequentially in a single threaded loop.
Delete Old CSAR - Checks if CSAR already exists in the watched directory, if so it deletes it
Add CSAR - Adds CSAR to the directory that distribution is watching
Get Healthcheck - Ensures Healthcheck is returning 200 OK
Get Metrics - Ensures Metrics is returning 200 OK
Assert PDP Group Query - Checks that PDPGroupQuery contains the deployed policy
Assert PoliciesDeployed - Checks that the policy is deployed
Undeploy/Delete Policy - Undeploys and deletes the Policy for the next loop
Assert PDP Group Query for Deleted Policy - Ensures the policy has been removed and does not exist
The following steps can be used to configure the parameters of the test plan.
HTTP Authorization Manager - used to store user/password authentication details.
HTTP Header Manager - used to store headers which will be used for making HTTP requests.
User Defined Variables - used to store following user defined parameters.
Name |
Description |
|---|---|
PAP_HOST |
IP Address or host name of PAP component |
PAP_PORT |
Port number of PAP for making REST API calls |
API_HOST |
IP Address or host name of API component |
API_PORT |
Port number of API for making REST API calls |
DURATION |
Duration of Test |
Screenshot of Distribution stability test plan
Running the Test Plan
The main script takes care of everything. To run the 72 hour stability tests do as follows
cd testsuites
./run-s3p-test.sh stability 259200
visualvm produces the monitor and threads - we can screenshot those and add them to the test results
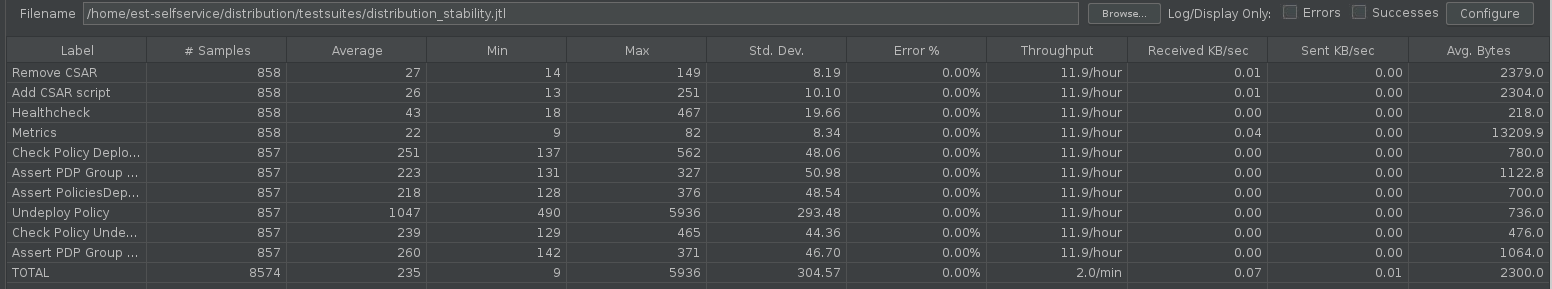
A jmeter .jtl file is produced by the run - it is called distribution-stability.jtl
The file can be imported into the jmeter GUI to view statistics
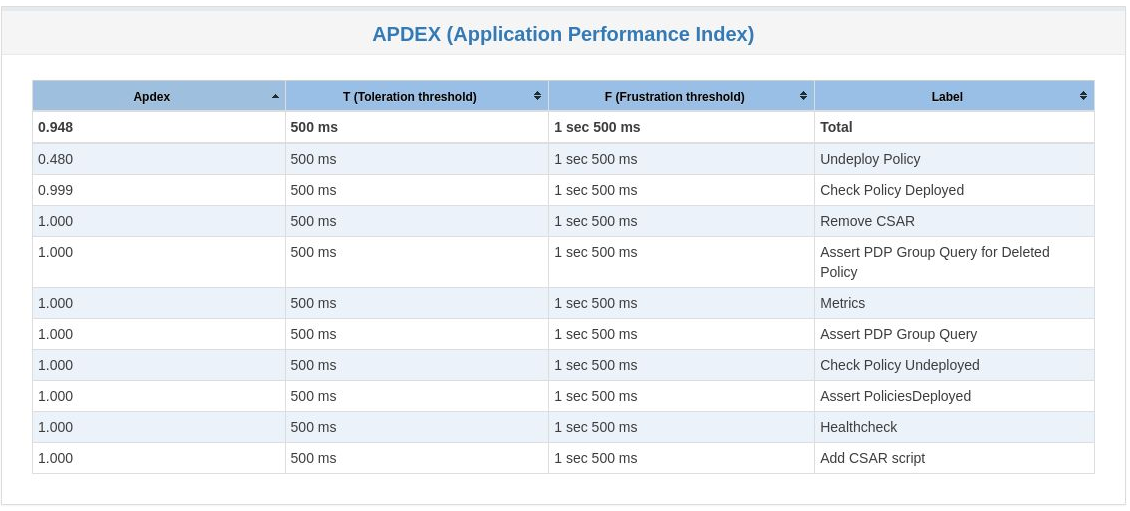
The application performance index table can be produced with jmeter on the cli as below:ls
jmeter -n -t your_test_plan.jmx -l test_results.jtl -e -o report_directory
Test Results
Summary
Stability test plan was triggered for 72 hours.
No errors were reported
Test Statistics
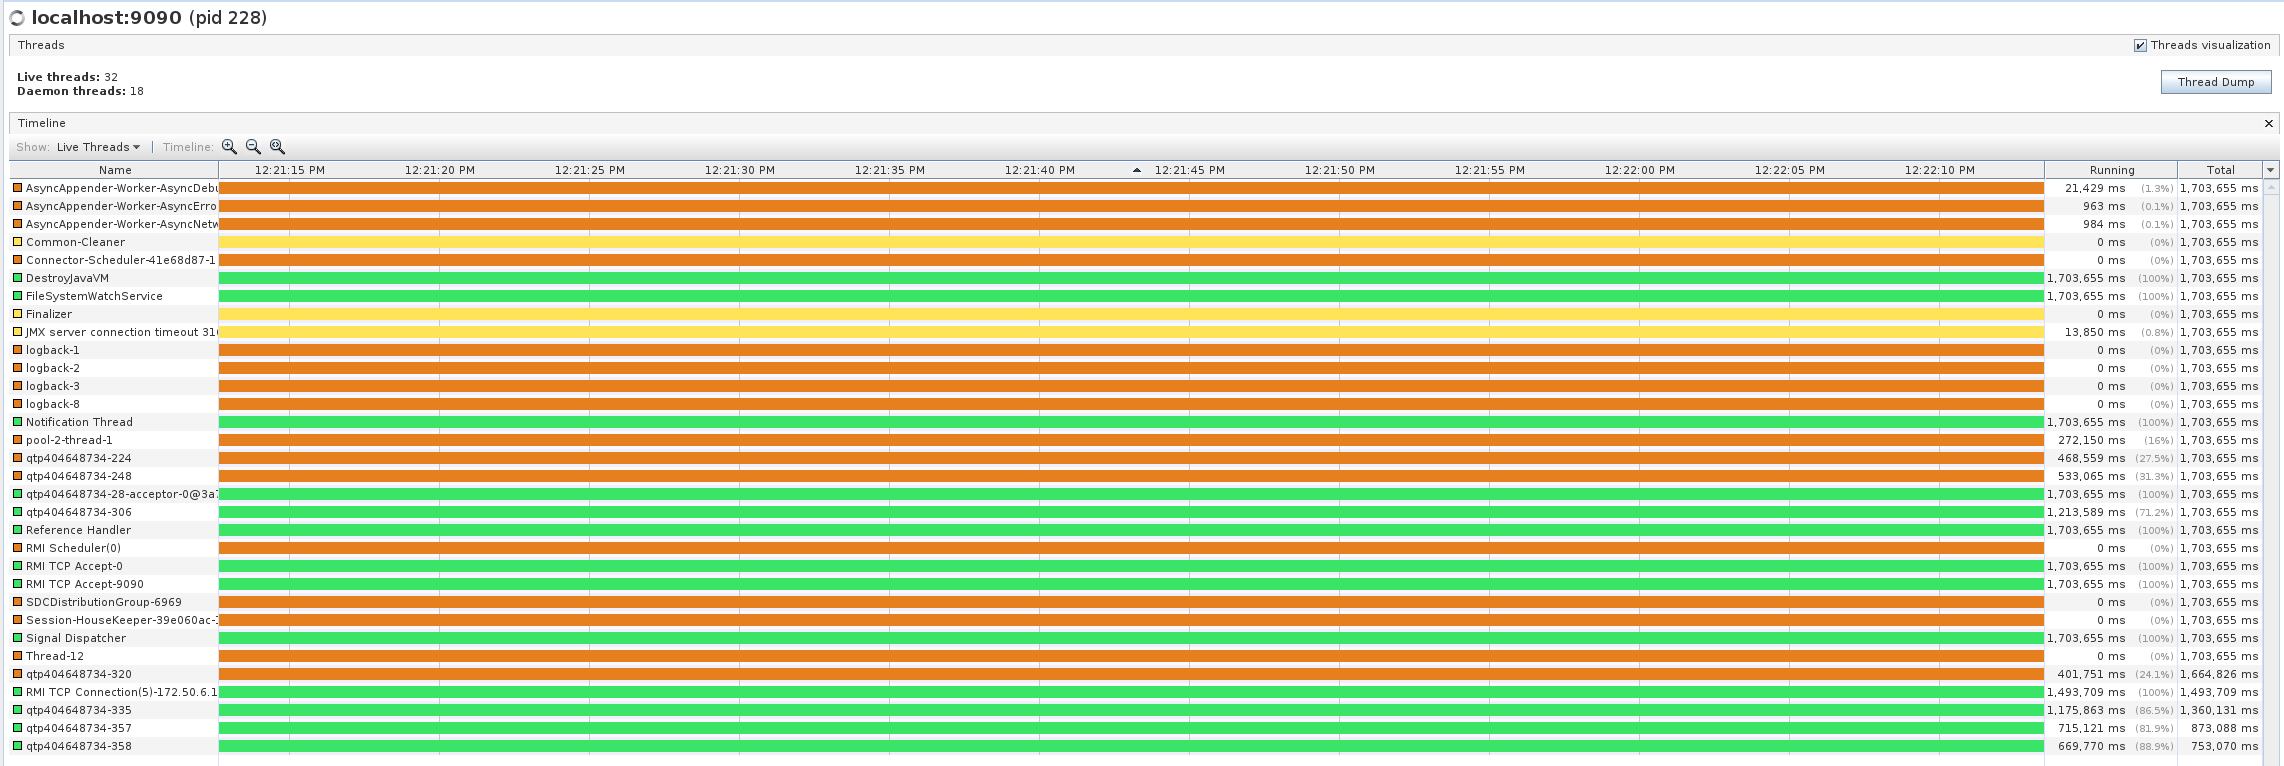
VisualVM Screenshots
Performance Test of Policy Distribution
Introduction
The 4h Performance Test of Policy Distribution has the goal of testing the min/avg/max processing time and rest call throughput for all the requests when the number of requests are large enough to saturate the resource and find the bottleneck.
It also tests that distribution can handle multiple policy CSARs and that these are deployed within 60 seconds consistently.
Setup Details
The performance test is based on the same setup as the distribution stability tests. This setup is done by the main run-s3p-test.sh script
Test Plan Sequence
Performance test plan is different from the stability test plan.
Instead of handling one policy csar at a time, multiple csar’s are deployed within the watched folder at the exact same time.
We expect all policies from these csar’s to be deployed within 60 seconds.
There are also multithreaded tests running towards the healthcheck and statistics endpoints of the distribution service.
Running the Test Plan
The main script takes care of everything. To run the 4 hour performance tests do as follows
cd testsuites
./run-s3p-test.sh performance 14400
visualvm produces the monitor and threads - we can screenshot those and add them to the test results
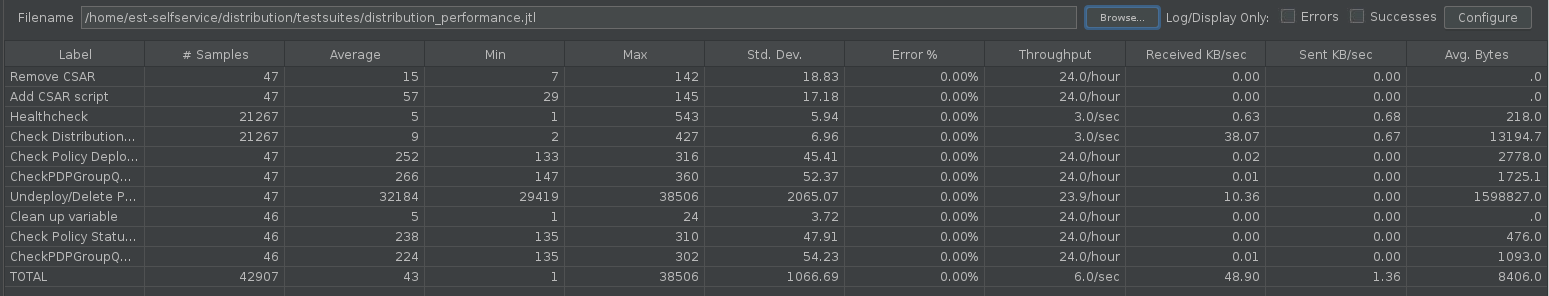
A jmeter .jtl file is produced by the run - it is called distribution-performance.jtl
The file can be imported into the jmeter GUI to view statistics
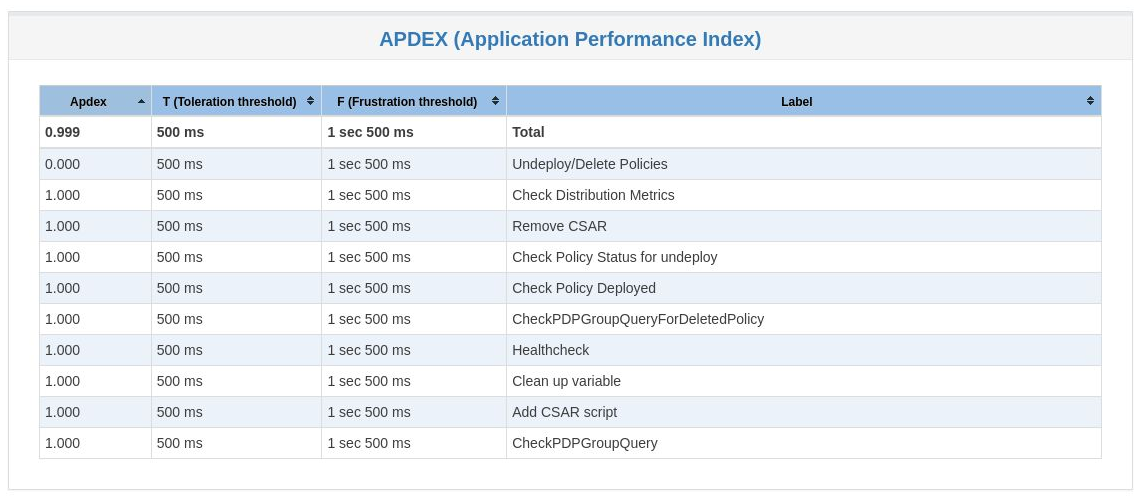
The application performance index table can be produced with jmeter on the cli as below:
jmeter -n -t your_test_plan.jmx -l test_results.jtl -e -o report_directory
This produced html pages where statistics tables can be seen and added to the results.
Test Results
Summary
Performance test plan was triggered for 4 hours.
No errors were reported
Test Statistics
VisualVM Screenshots
End of document