Policy API S3P Tests
72 Hours Stability Test of Policy API
Introduction
The 72 hour stability test of policy API has the goal of verifying the stability of running policy design API REST service by ingesting a steady flow of transactions in a multi-threaded fashion to simulate multiple clients’ behaviours. All the transaction flows are initiated from a test client server running JMeter for the duration of 72 hours.
Setup Details
The stability test was performed on a default ONAP OOM installation in the Nordix Lab environment. JMeter was installed on a separate VM to inject the traffic defined in the API stability script with the following command:
nohup apache-jmeter-5.5/bin/jmeter -n -t policy_api_stability.jmx -l stabilityTestResultsPolicyApi.jtl &
The test was run in the background via “nohup” and “&”, to prevent it from being interrupted.
Test Plan
The 72+ hours stability test will be running the following steps sequentially in multi-threaded loops. Thread number is set to 5 to simulate 5 API clients’ behaviours (they can be calling the same policy CRUD API simultaneously). Each thread creates a different version of the policy types and policies to not interfere with one another while operating simultaneously. The point version of each entity is set to the running thread number.
Setup Thread (will be running only once)
Get policy-api Healthcheck
Get API Counter Statistics
Get Preloaded Policy Types
API Test Flow (5 threads running the same steps in the same loop)
Create a new Monitoring Policy Type with Version 6.0.#
Create a new Monitoring Policy Type with Version 7.0.#
Create a new Optimization Policy Type with Version 6.0.#
Create a new Guard Policy Type with Version 6.0.#
Create a new Native APEX Policy Type with Version 6.0.#
Create a new Native Drools Policy Type with Version 6.0.#
Create a new Native XACML Policy Type with Version 6.0.#
Get All Policy Types
Get All Versions of the new Monitoring Policy Type
Get Version 6.0.# of the new Monitoring Policy Type
Get Version 6.0.# of the new Optimization Policy Type
Get Version 6.0.# of the new Guard Policy Type
Get Version 6.0.# of the new Native APEX Policy Type
Get Version 6.0.# of the new Native Drools Policy Type
Get Version 6.0.# of the new Native XACML Policy Type
Get the Latest Version of the New Monitoring Policy Type
Create Version 6.0.# of Node Template
Create Monitoring Policy Ver 6.0.# w/Monitoring Policy Type Ver 6.0.#
Create Monitoring Policy Ver 7.0.# w/Monitoring Policy Type Ver 7.0.#
Create Optimization Policy Ver 6.0.# w/Optimization Policy Type Ver 6.0.#
Create Guard Policy Ver 6.0.# w/Guard Policy Type Ver 6.0.#
Create Native APEX Policy Ver 6.0.# w/Native APEX Policy Type Ver 6.0.#
Create Native Drools Policy Ver 6.0.# w/Native Drools Policy Type Ver 6.0.#
Create Native XACML Policy Ver 6.0.# w/Native XACML Policy Type Ver 6.0.#
Create Version 6.0.# of PNF Example Policy with Metadata
Get Node Template
Get All TCA Policies
Get All Versions of Monitoring Policy Type
Get Version 6.0.# of the new Monitoring Policy
Get Version 6.0.# of the new Optimization Policy
Get Version 6.0.# of the new Guard Policy
Get Version 6.0.# of the new Native APEX Policy
Get Version 6.0.# of the new Native Drools Policy
Get Version 6.0.# of the new Native XACML Policy
Get the Latest Version of the new Monitoring Policy
Delete Version 6.0.# of the new Monitoring Policy
Delete Version 7.0.# of the new Monitoring Policy
Delete Version 6.0.# of the new OptimizationPolicy
Delete Version 6.0.# of the new Guard Policy
Delete Version 6.0.# of the new Native APEX Policy
Delete Version 6.0.# of PNF Example Policy having Metadata
Delete Version 6.0.# of the new Native Drools Policy
Delete Version 6.0.# of the new Native XACML Policy
Delete Monitoring Policy Type with Version 6.0.#
Delete Monitoring Policy Type with Version 7.0.#
Delete Optimization Policy Type with Version 6.0.#
Delete Guard Policy Type with Version 6.0.#
Delete Native APEX Policy Type with Version 6.0.#
Delete Native Drools Policy Type with Version 6.0.#
Delete Native XACML Policy Type with Version 6.0.#
Delete Node Template
Get Policy Metrics
TearDown Thread (will only be running after API Test Flow is completed)
Get policy-api Healthcheck
Get Preloaded Policy Types
Test Results
Summary
No errors were found during the 72 hours of the Policy API stability run. The load was performed against a non-tweaked ONAP OOM installation.
Test Statistics
Total # of requests |
Success % |
TPS |
Avg. time taken per request |
Min. time taken per request |
Max. time taken per request |
|---|---|---|---|---|---|
950839 |
100% |
3.67 |
1351 ms |
126 ms |
16324 ms |
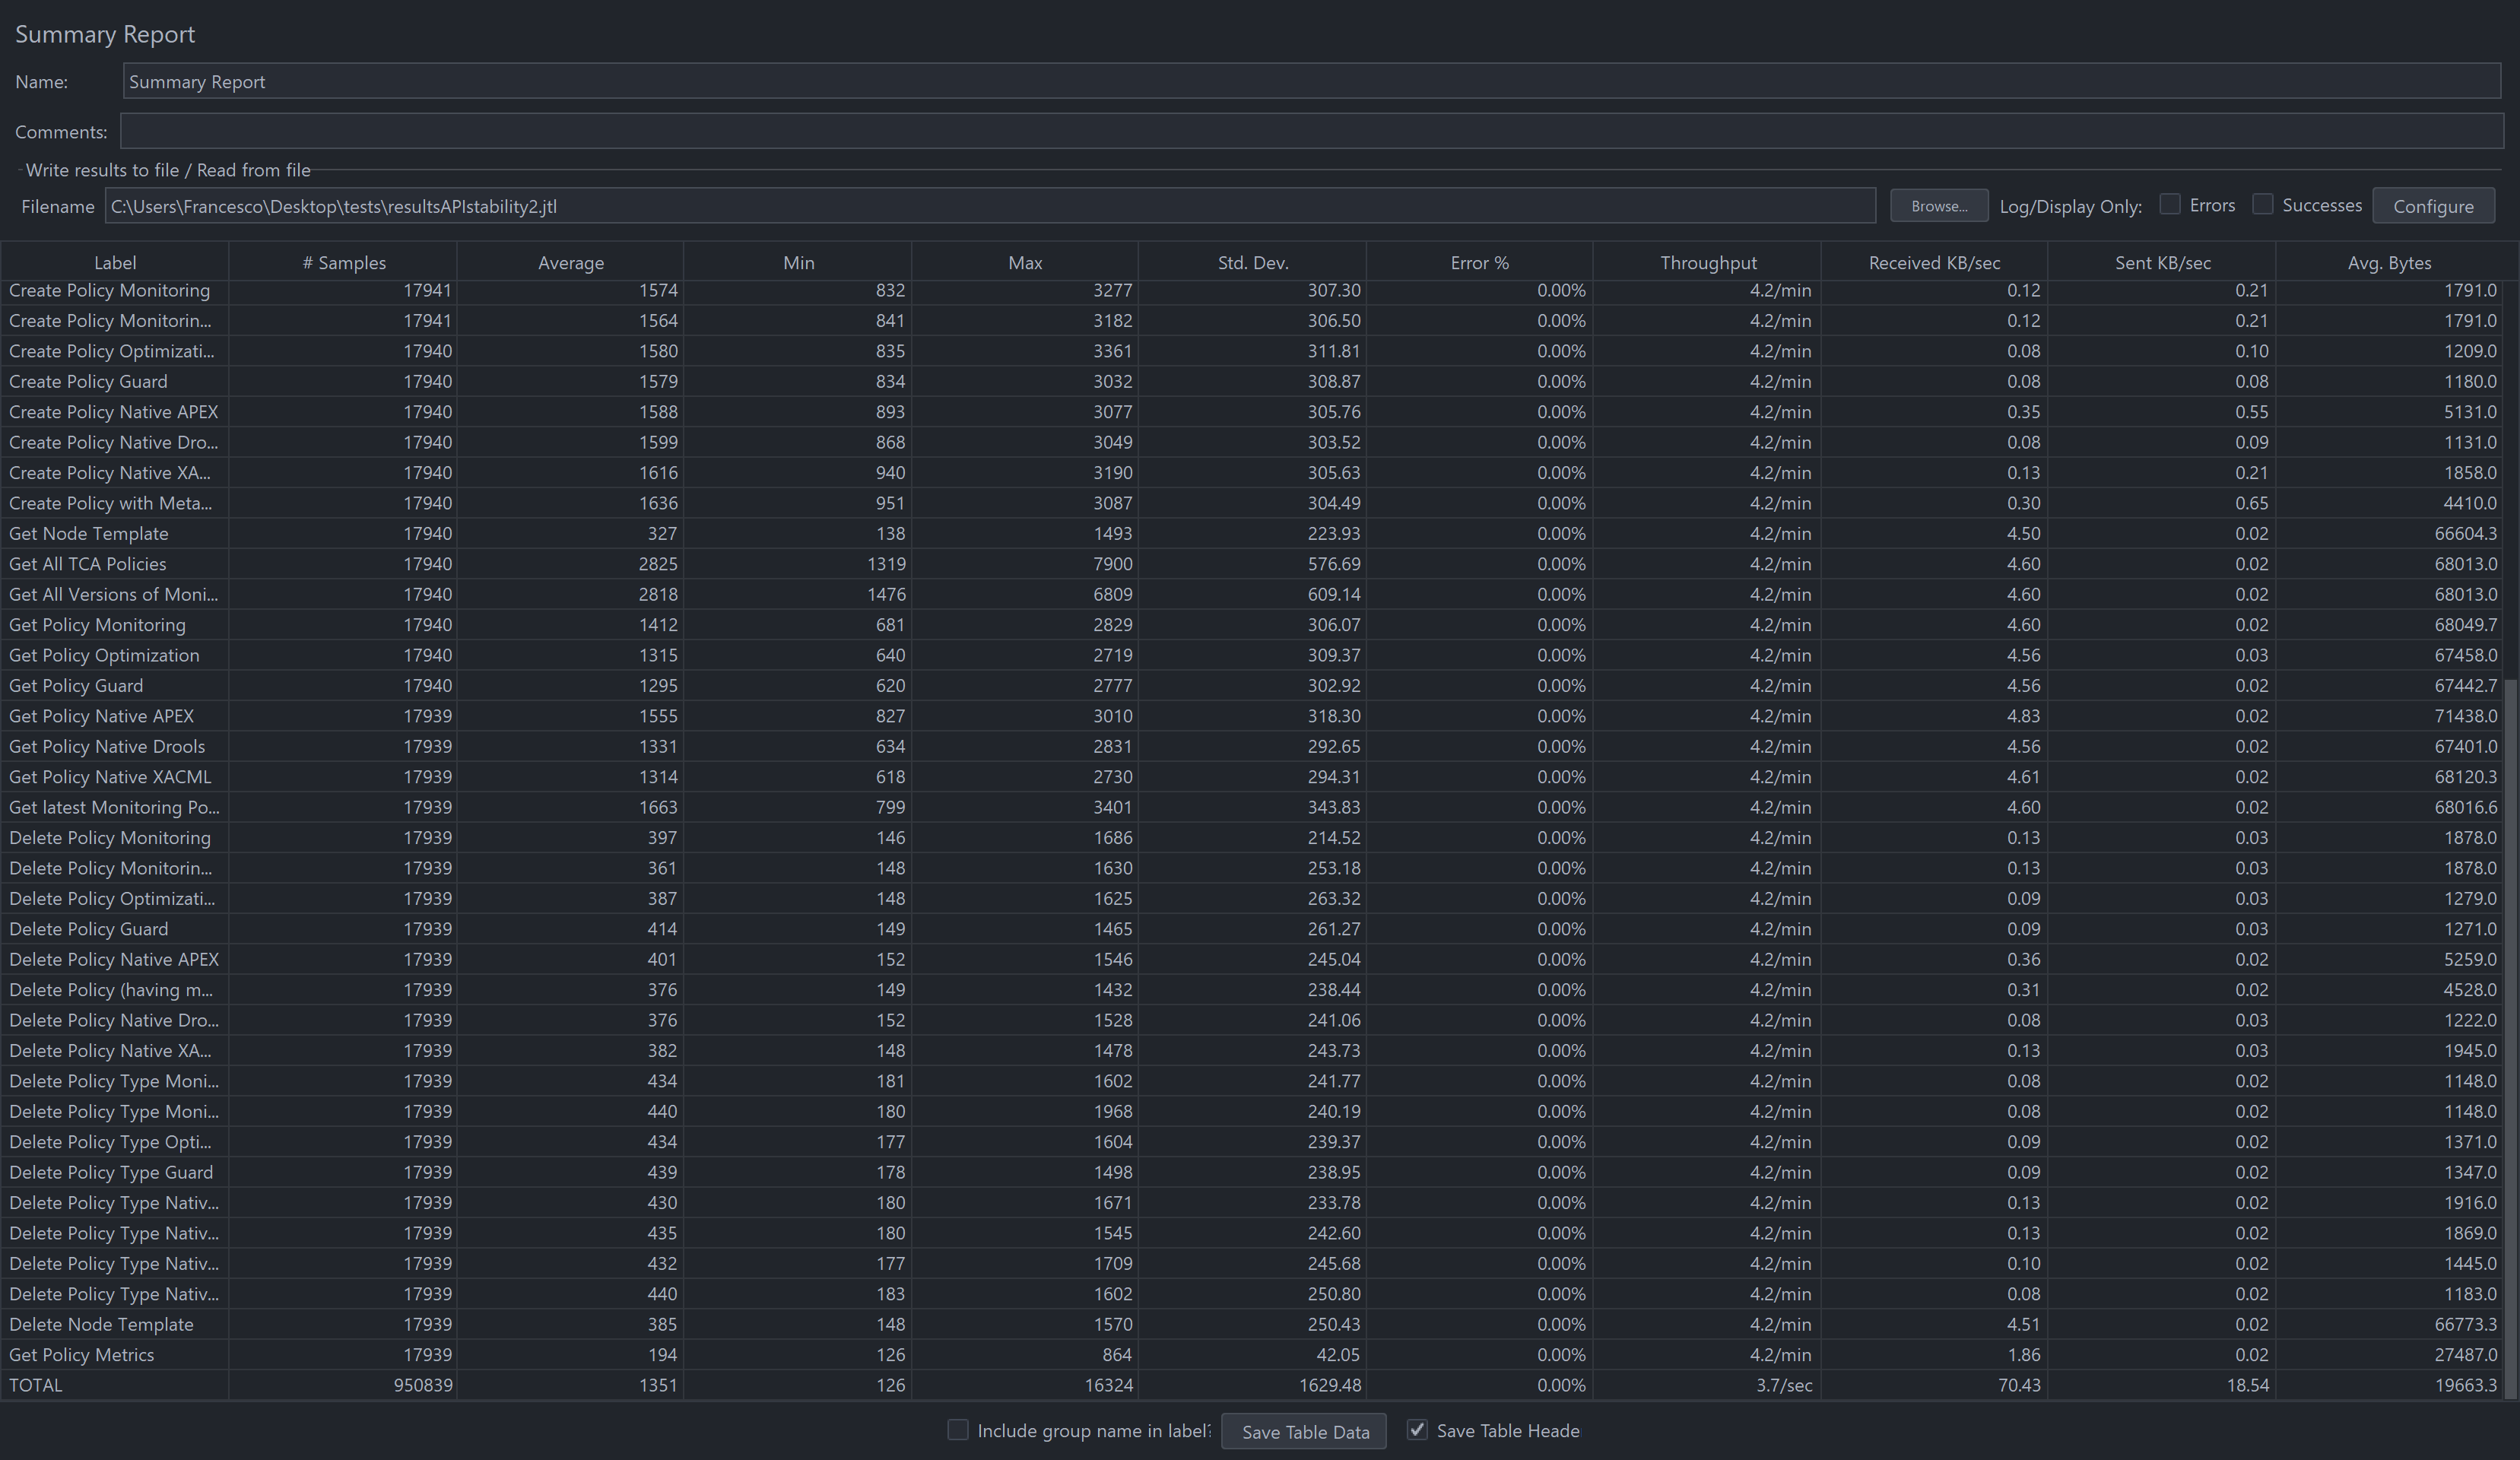
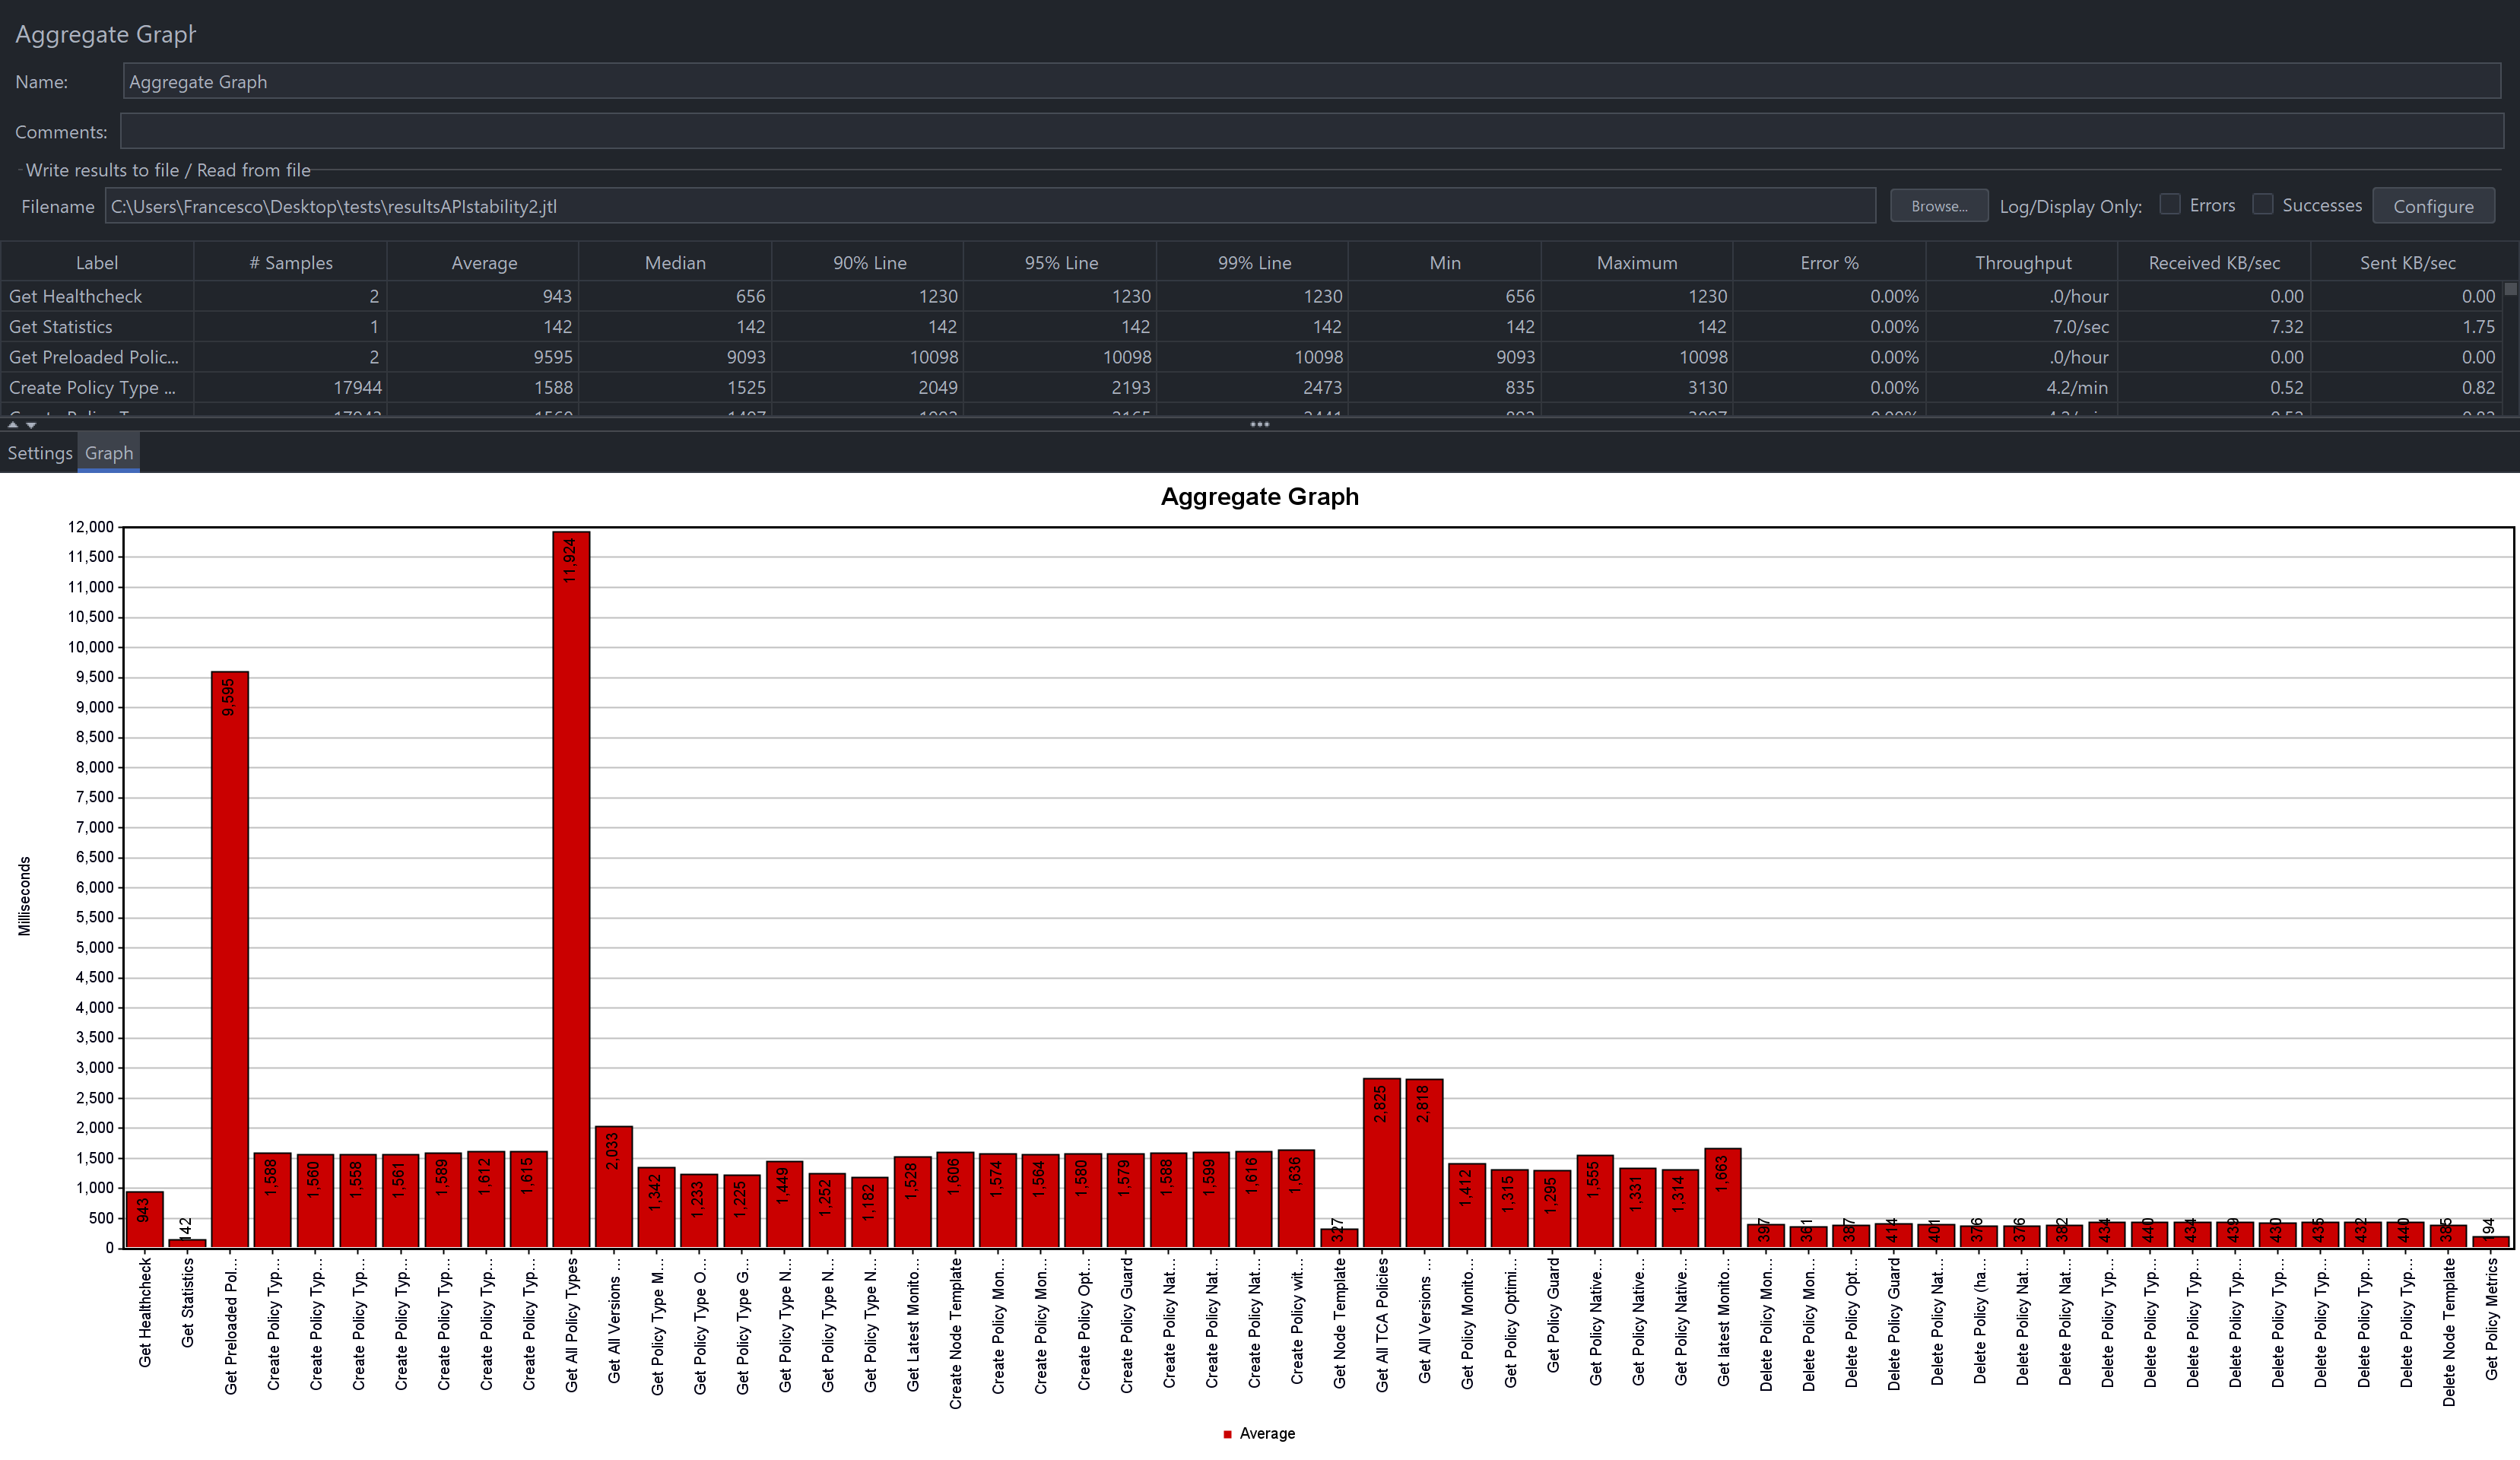
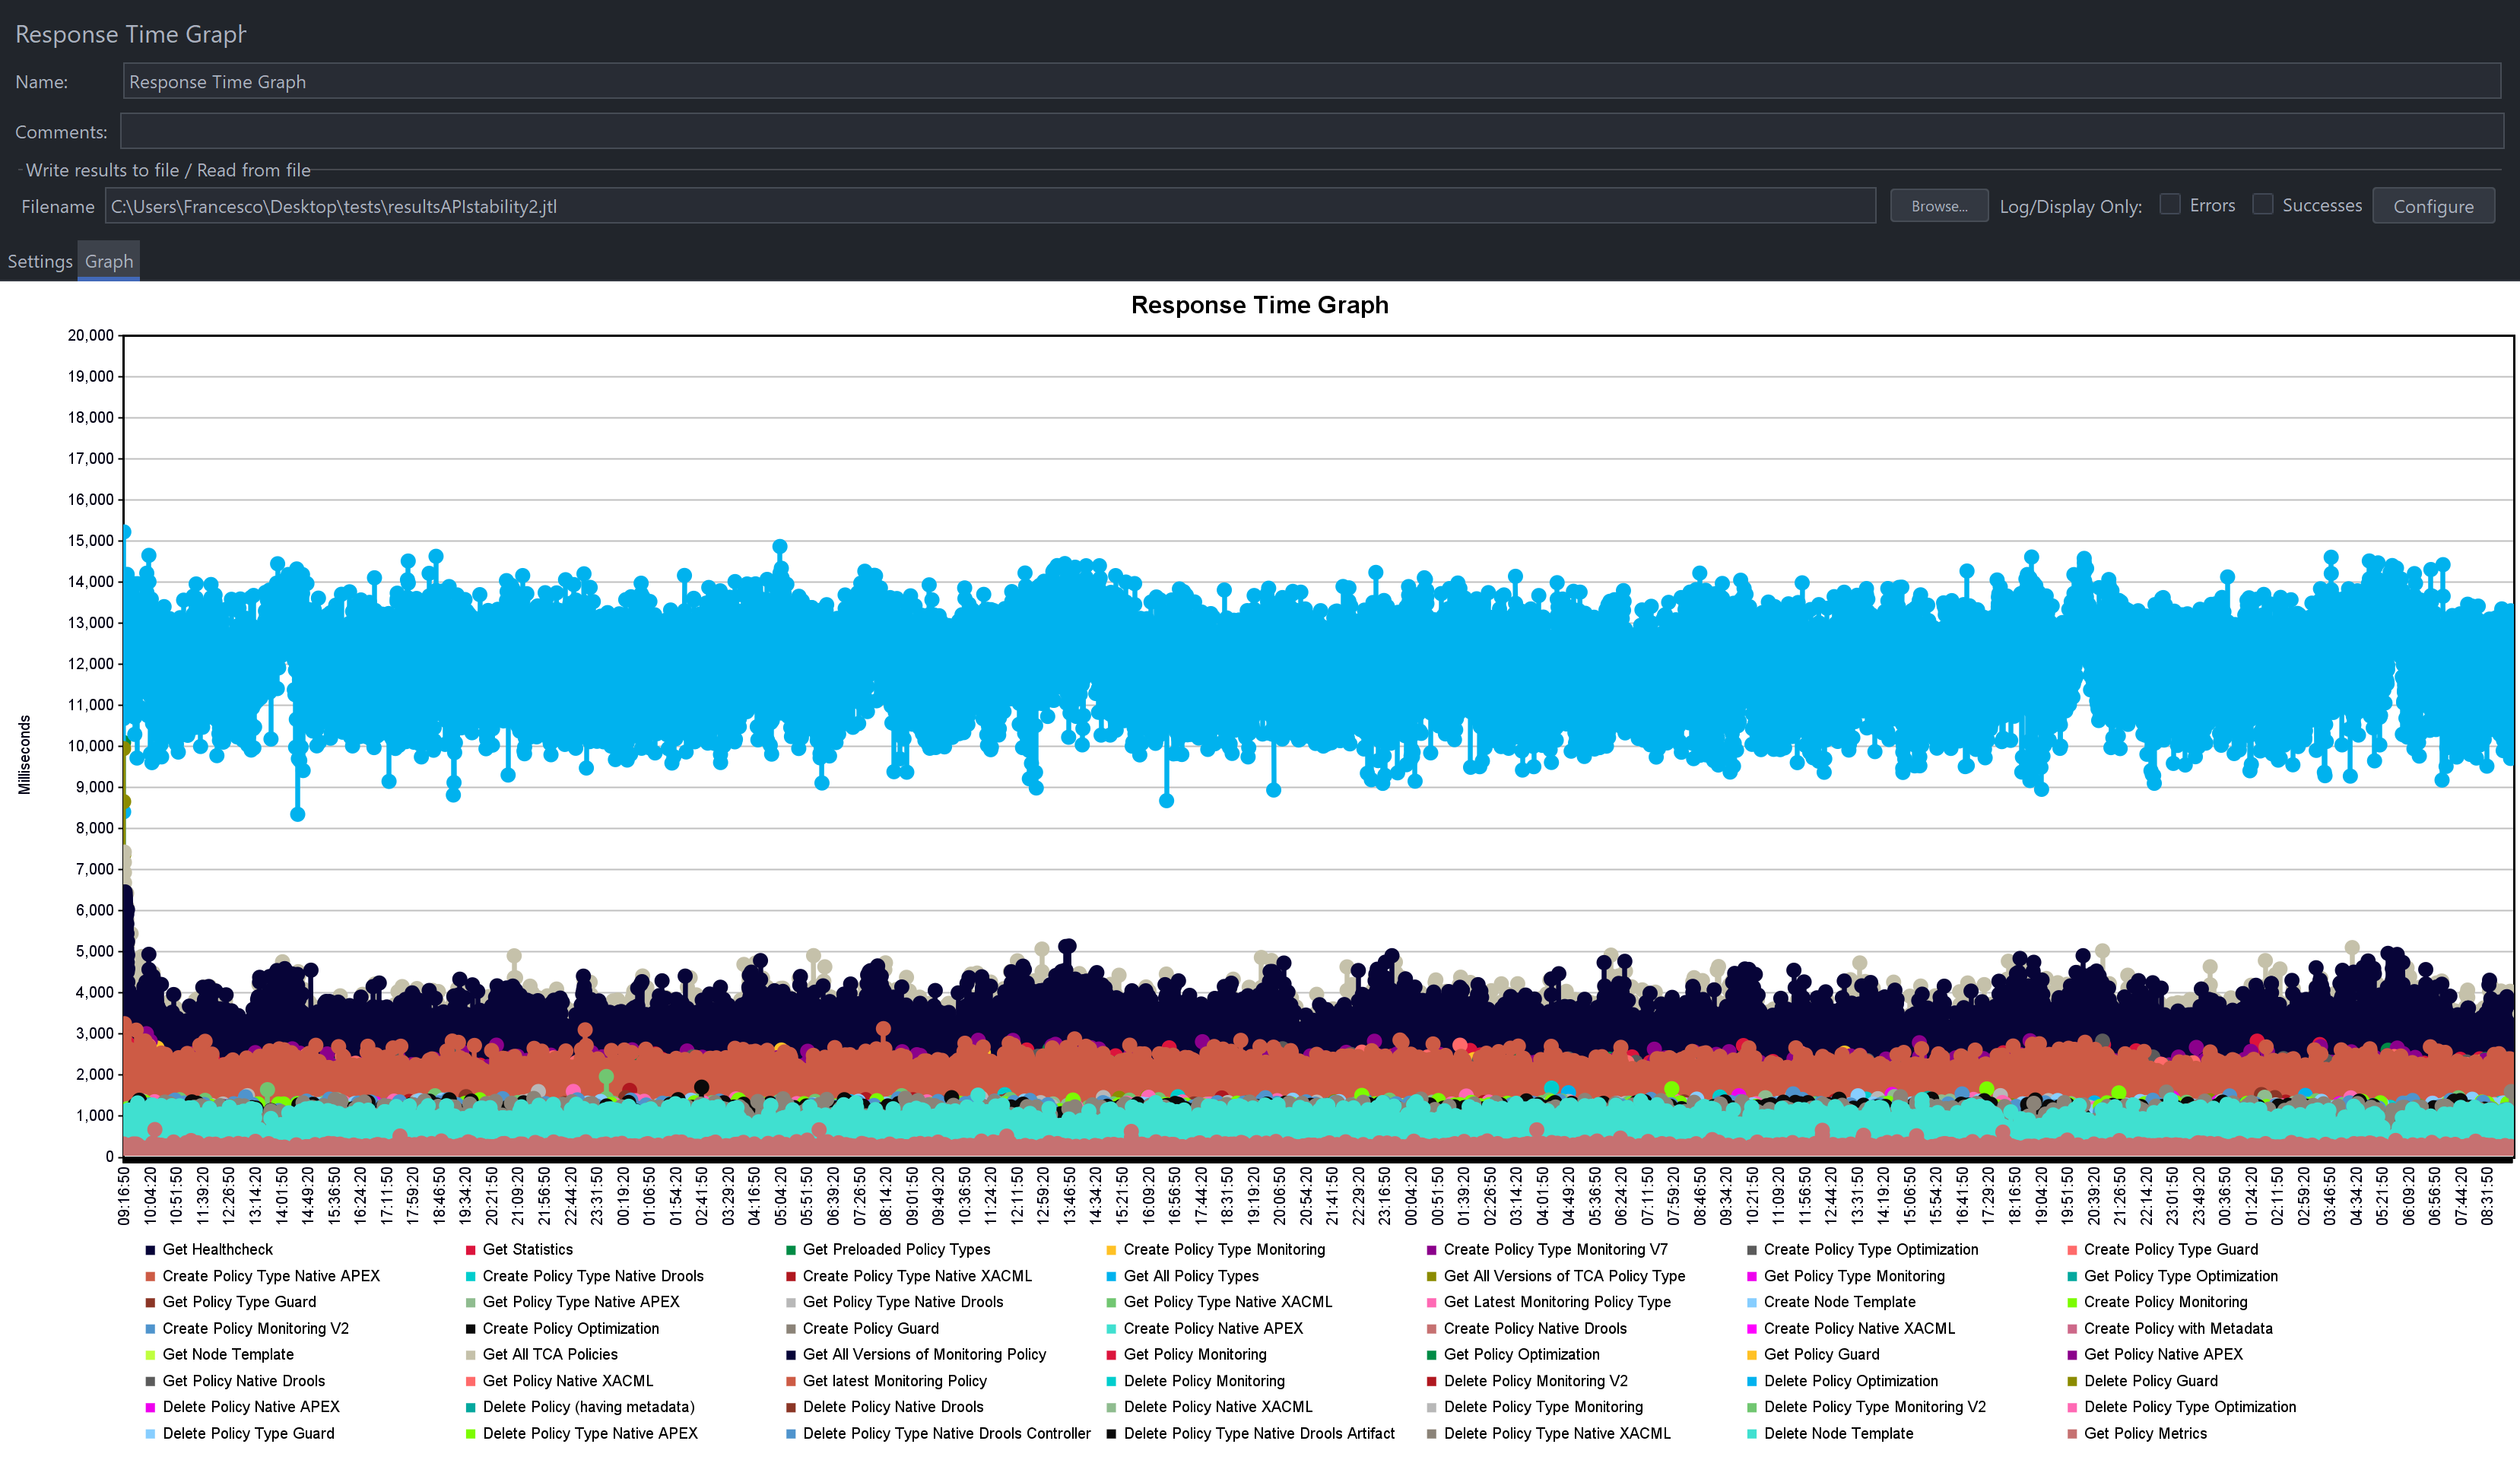
JMeter Results
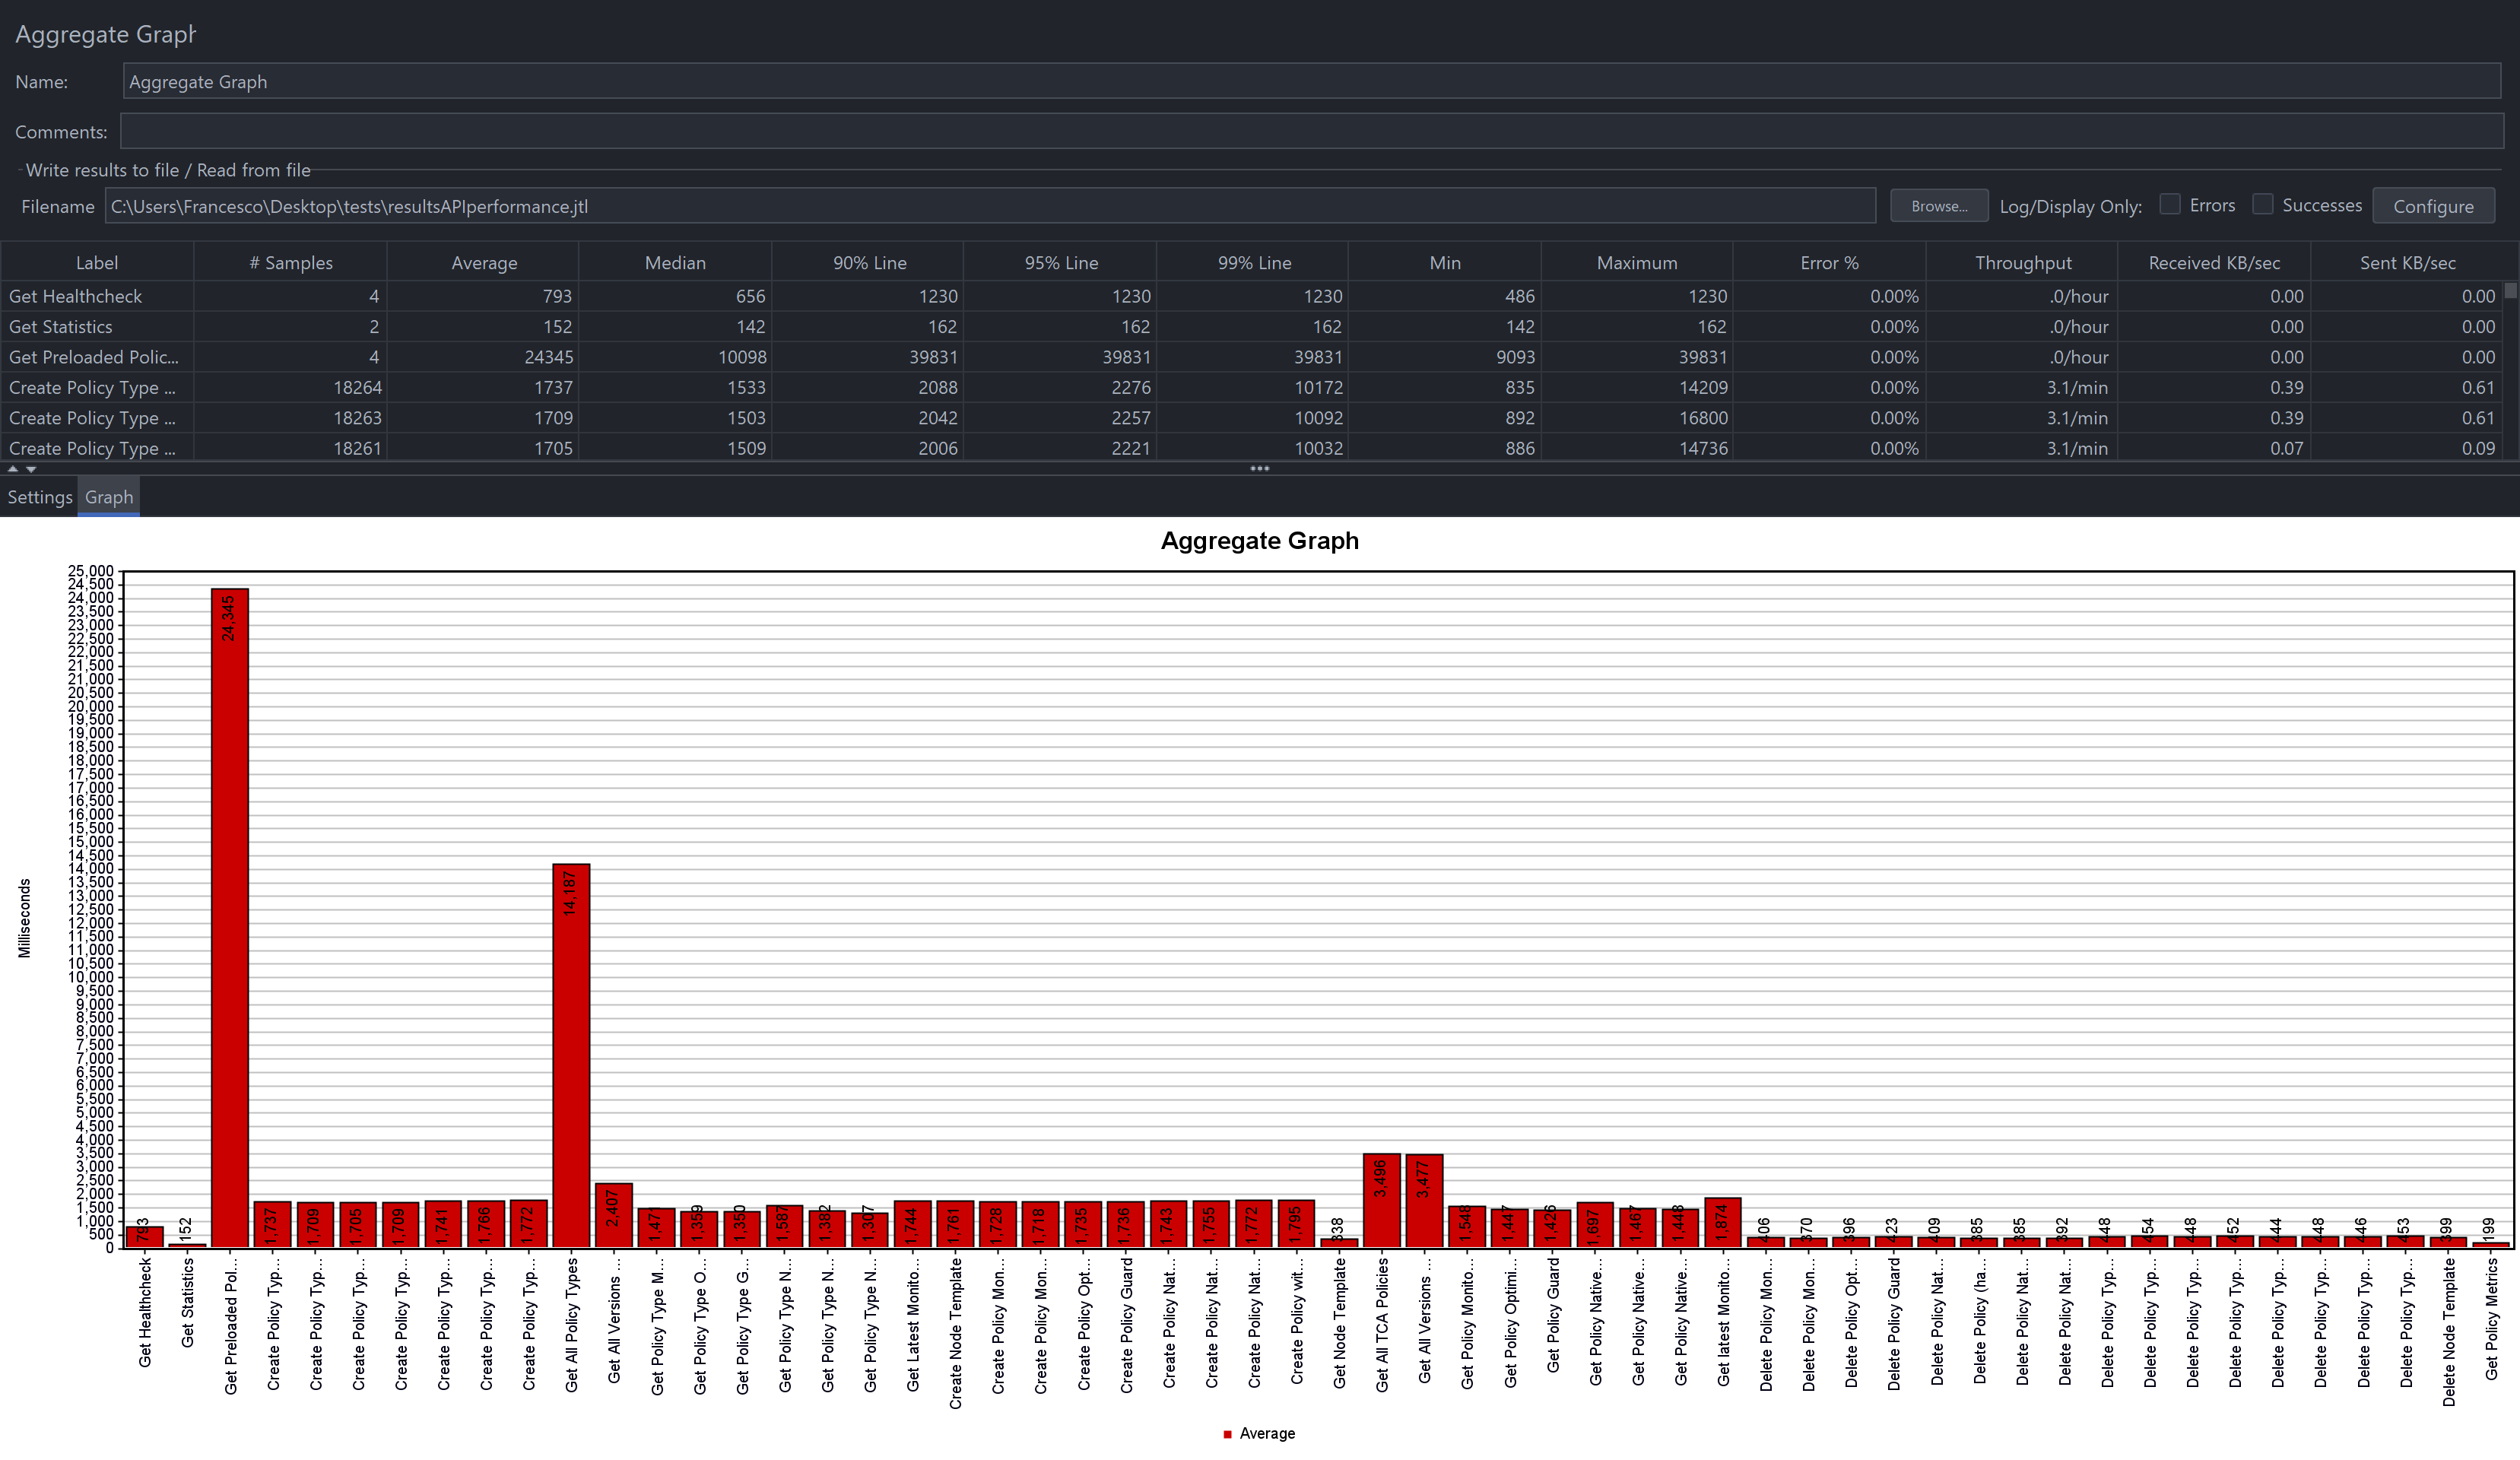
The following graphs show the response time distributions. The “Get Policy Types” API calls are the most expensive calls that average a 13 seconds plus response time.
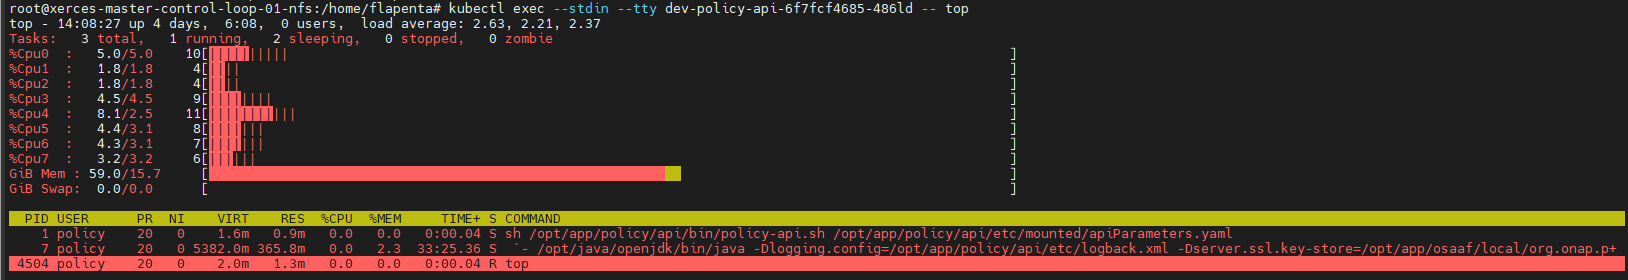
Memory and CPU usage
The memory and CPU usage can be monitored by running “top” command in the policy-api pod. A snapshot is taken before and after test execution to monitor the changes in resource utilization.
Memory and CPU usage before test execution:
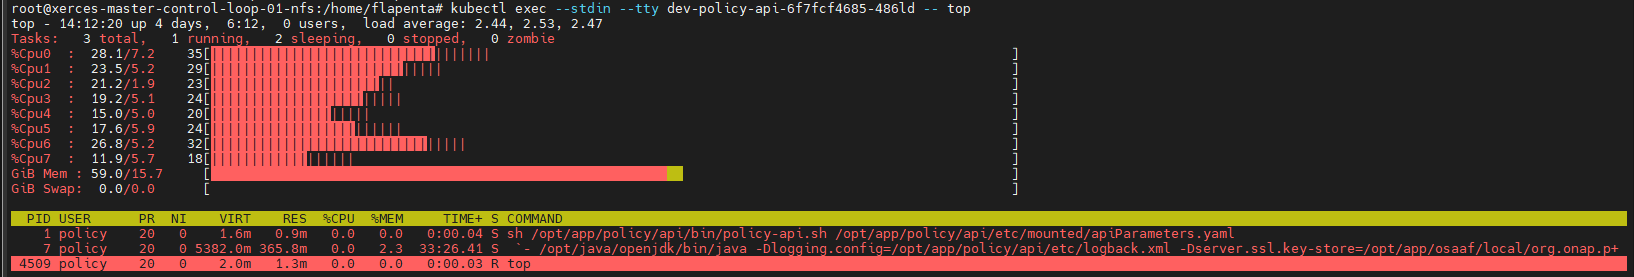
Memory and CPU usage after test execution:
Performance Test of Policy API
Introduction
Performance test of policy-api has the goal of testing the min/avg/max processing time and rest call throughput for all the requests when the number of requests are large enough to saturate the resource and find the bottleneck.
Setup Details
The performance test was performed on a default ONAP OOM installation in the Nordix Lab environment. JMeter was installed on a separate VM to inject the traffic defined in the API performance script with the following command:
nohup apache-jmeter-5.5/bin/jmeter -n -t policy_api_performance.jmx -l performanceTestResultsPolicyApi.jtl &
The test was run in the background via “nohup” and “&”, to prevent it from being interrupted.
Test Plan
Performance test plan is the same as stability test plan above. Only differences are, in performance test, we increase the number of threads up to 20 (simulating 20 users’ behaviours at the same time) whereas reducing the test time down to 2.5 hours.
Run Test
Running/Triggering performance test will be the same as stability test. That is, launch JMeter pointing to corresponding .jmx test plan. The API_HOST and API_PORT are already set up in .jmx.
Test Statistics
Total # of requests |
Success % |
TPS |
Avg. time taken per request |
Min. time taken per request |
Max. time taken per request |
|---|---|---|---|---|---|
16212 |
100% |
1.8 |
11109 ms |
162 ms |
237265 ms |
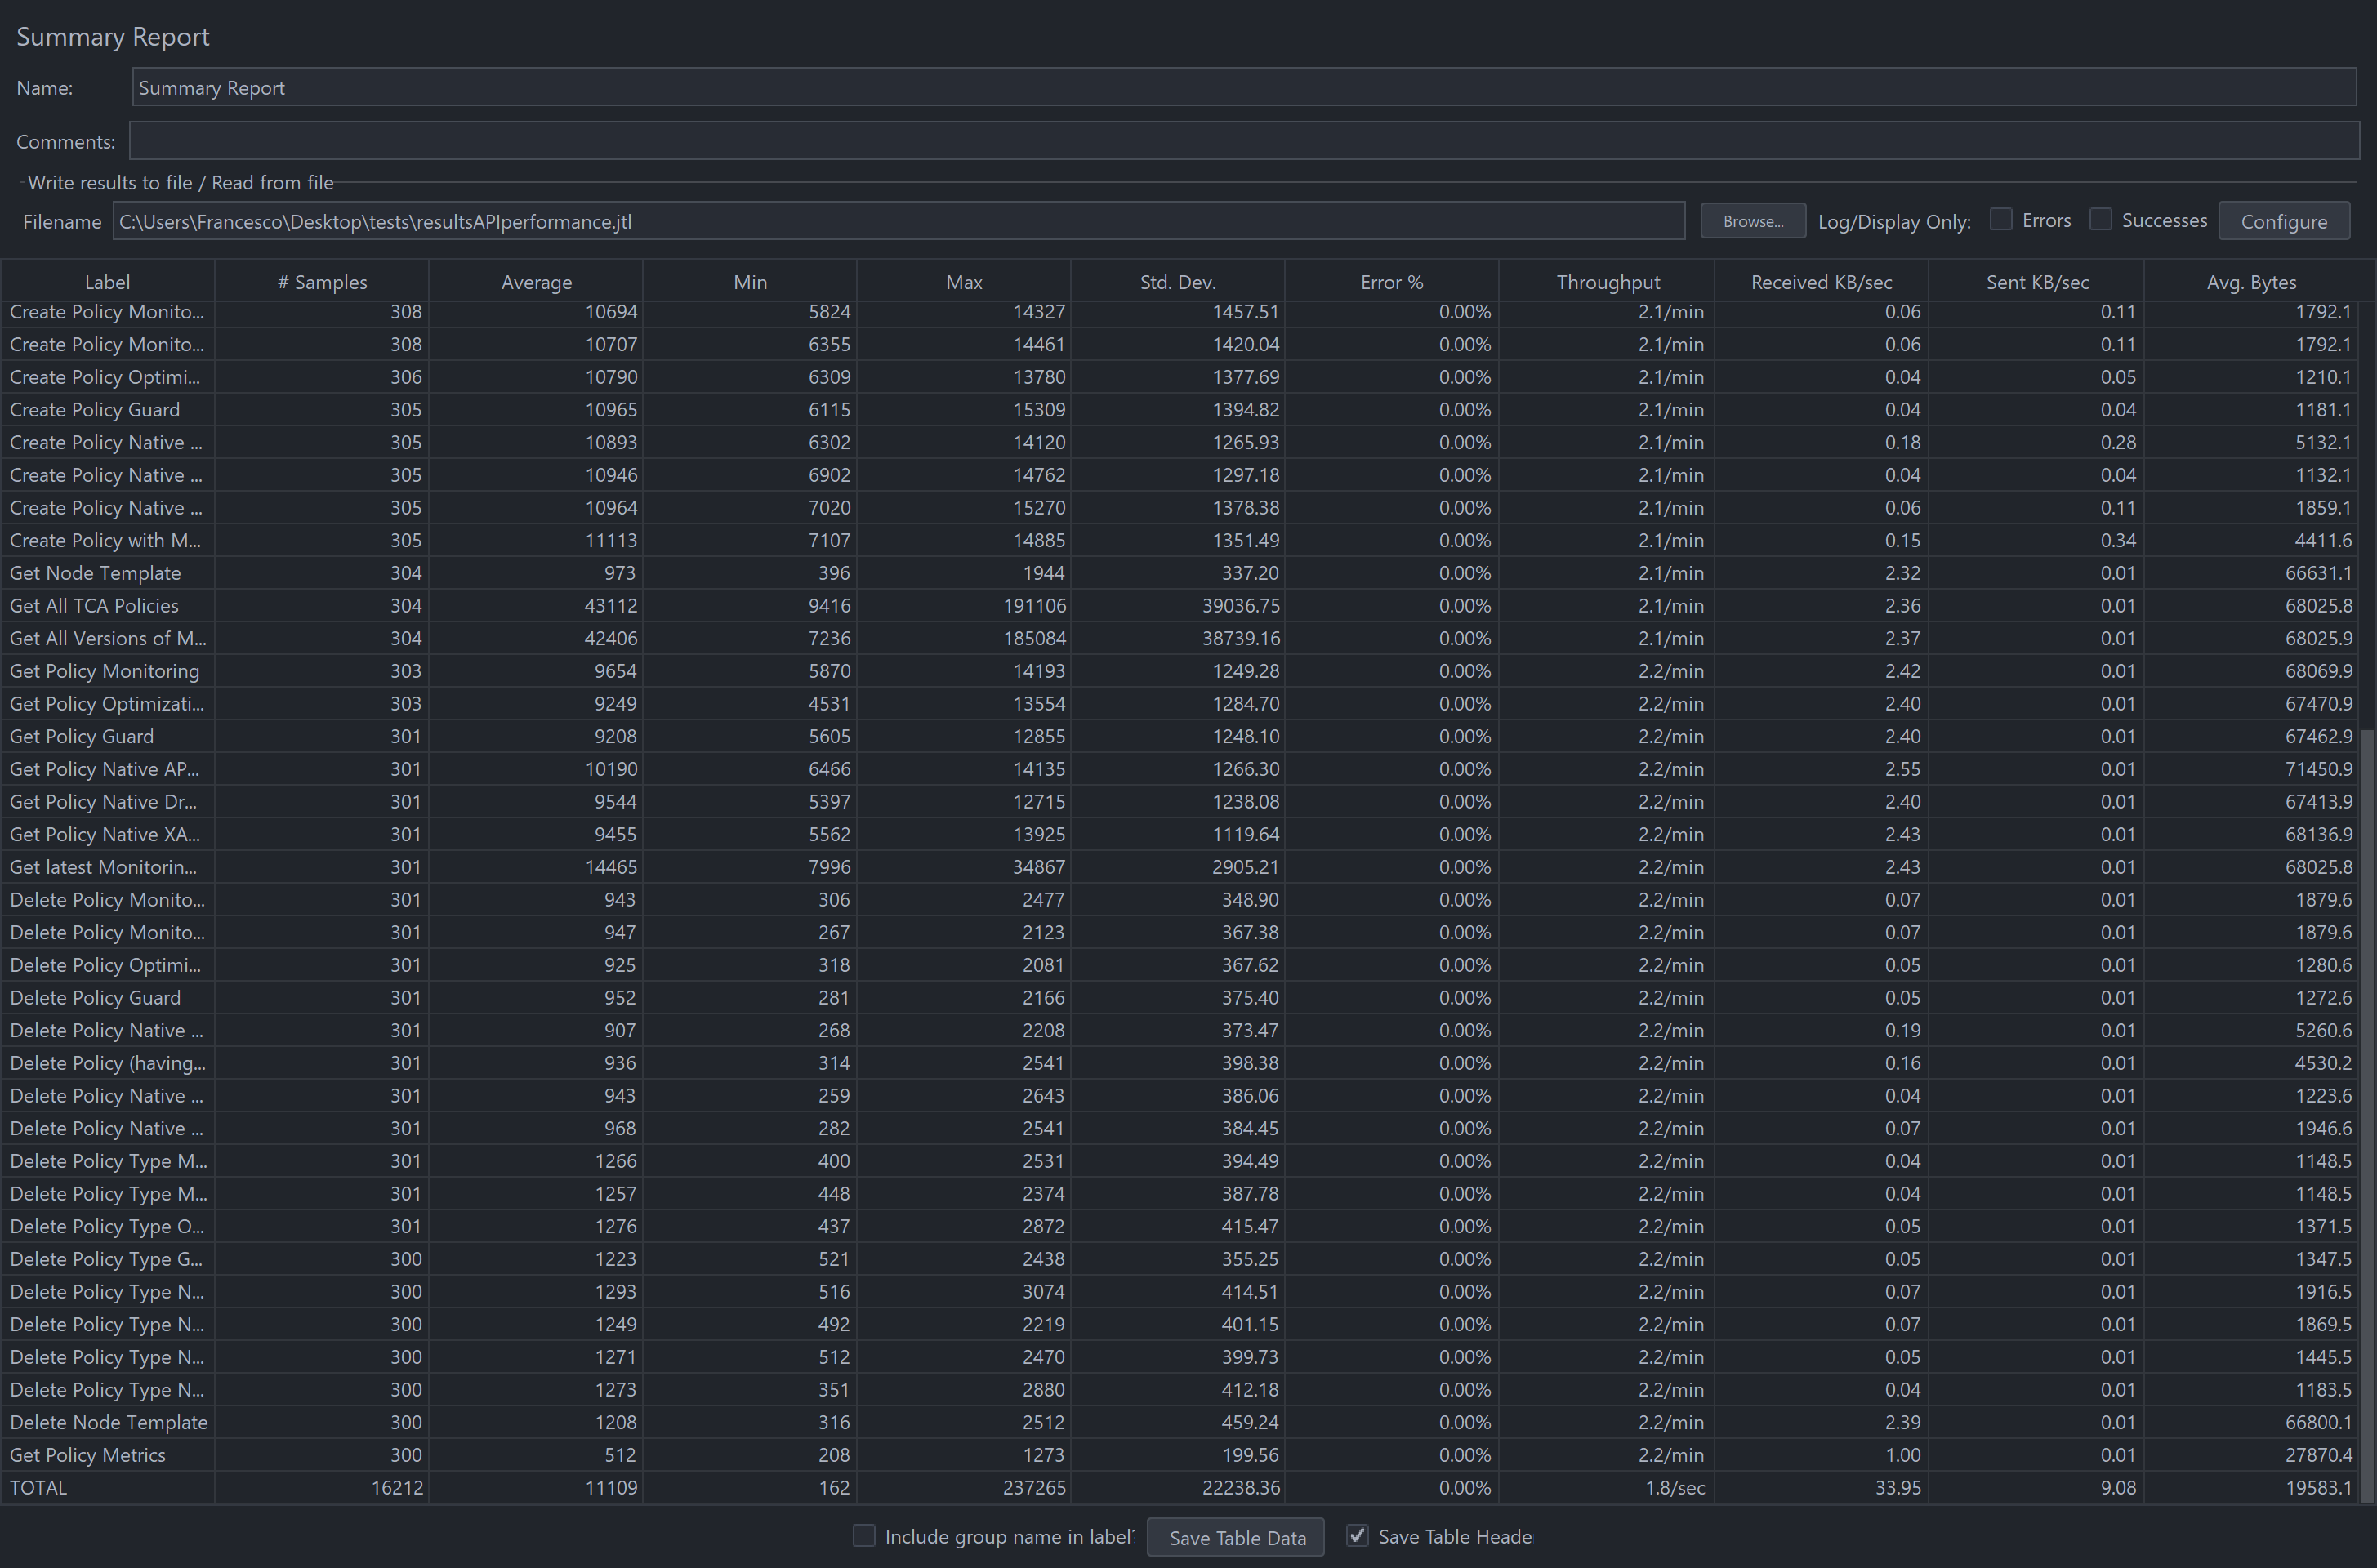
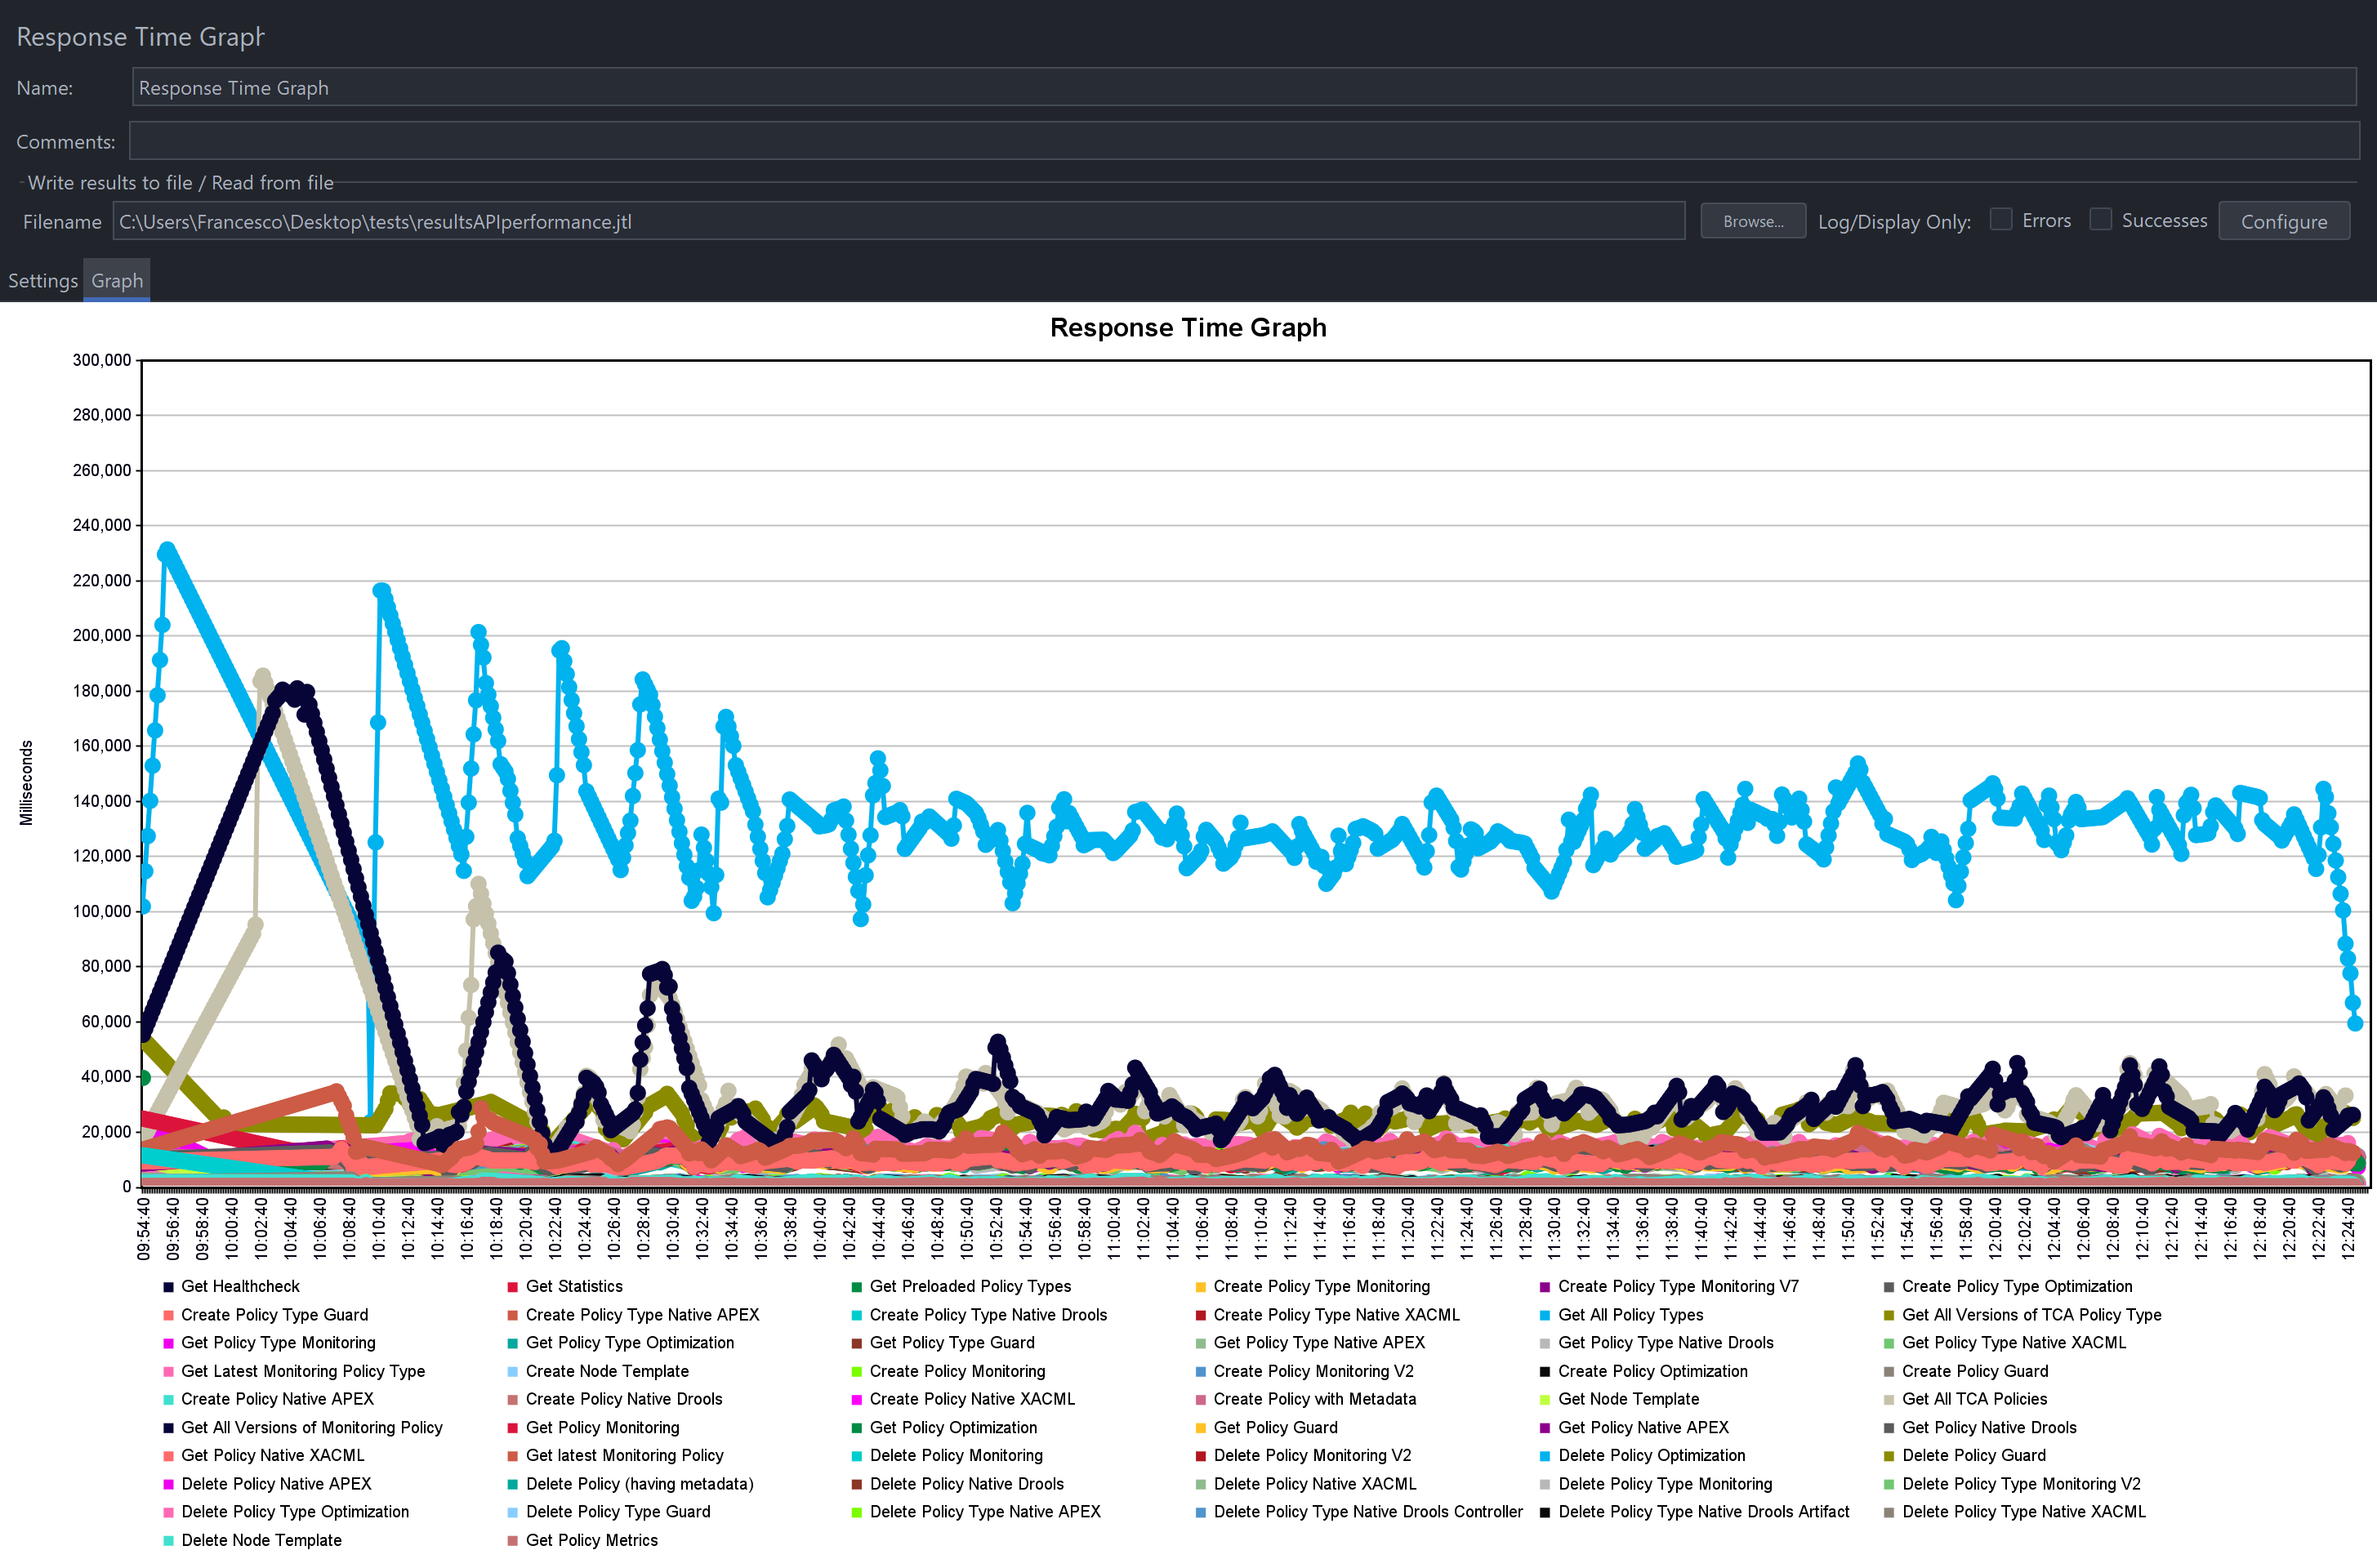
Test Results
The following graphs show the response time distributions.