Policy XACML PDP S3P Tests
Both the Performance and the Stability tests were executed by performing requests against Policy components installed in Kubernetes environment. These tests were all performed on a Ubuntu VM with 32GB of memory, 16 CPU and 100GB of disk space.
Policy XACML PDP Deployment
In an effort to allow the execution of the s3p tests to be as close to automatic as possible, a script will be executed that will perform the following:
Install of a microk8s kubernetes environment
Bring up the policy components
Checks that the components are successfully up and running before proceeding
Install Java 17
Install Jmeter locally and configure it
Specify whether you want to run stability or performance tests
The remainder of this document outlines how to run the tests and the test results
Common Setup
The common setup for performance and stability tests is now automated - being carried out by a script in- testsuites/run-s3p-test.sh.
Clone the policy-xacml-pdp repo to access the test scripts
git clone https://gerrit.onap.org/r/policy/xacml-pdp xacml-pdp
Stability Test of Policy XACML PDP
Test Plan
The 24 hours stability test ran the following steps.
Healthcheck, 2 simultaneous threads
- Decisions, 2 simultaneous threads, each running the following tasks in sequence:
Monitoring Decision
Monitoring Decision, abbreviated
Naming Decision
Optimization Decision
Default Guard Decision (always “Permit”)
Frequency Limiter Guard Decision
Min/Max Guard Decision
This runs for 24 hours. Test results are present in the testsuites/automated-performance/s3pTestResults.jtl file and in /tmp/ directory. Logs are present for jmeter in testsuites/automated-performance/jmeter.log and testsuites/automated-performance/nohup.out
Run Test
The code in the setup section also serves to run the tests. Just one execution needed to do it all.
bash run-s3p-test.sh run stability
Once the test execution is completed, the results are present in the automate-performance/s3pTestResults.jtl file.
This file can be imported into the Jmeter GUI for visualization. The below results are tabulated from the GUI.
Test Results
Summary
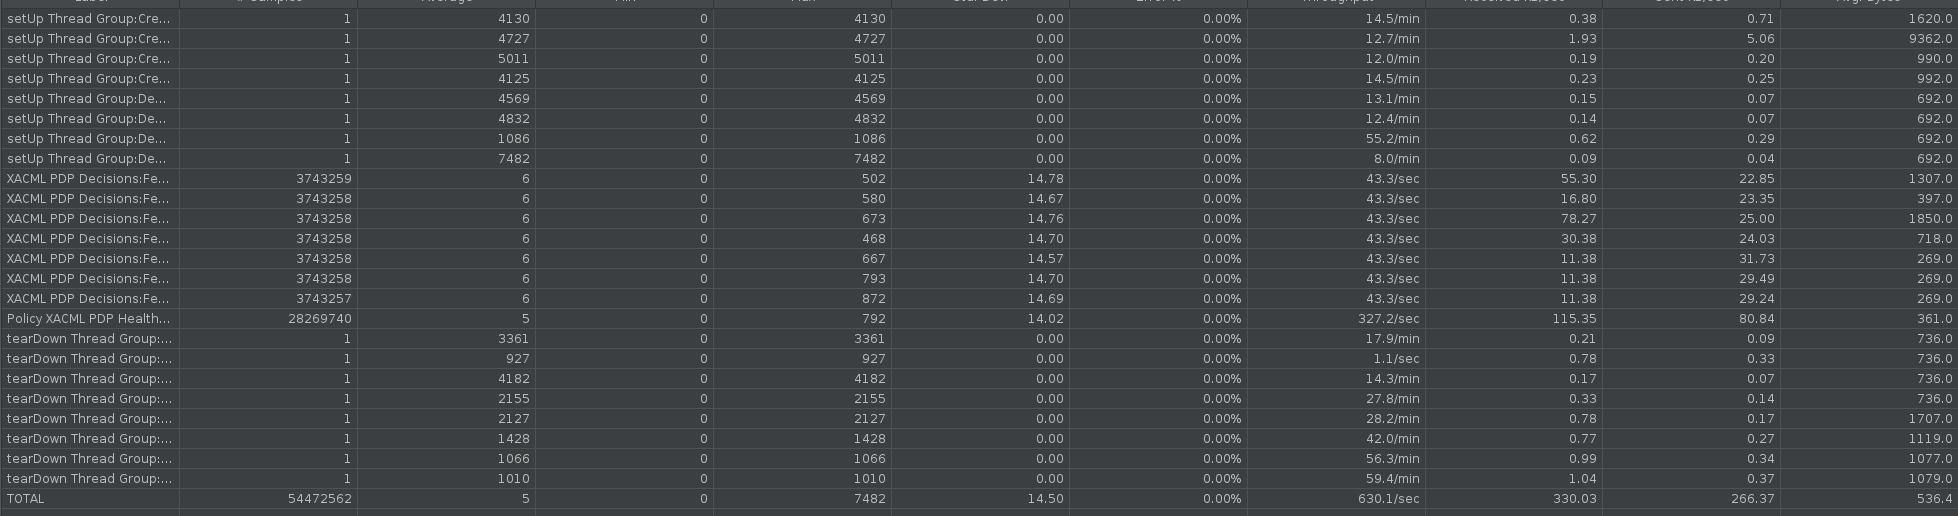
Stability test plan was triggered for 24 hours.
Test Statistics
Total # of requests |
Error % |
Average Latency (ms) |
Measured requests/sec |
|---|---|---|---|
54472562 |
0.00 % |
5 ms |
630.1 ms |
JMeter Results
Policy component Setup
NAME |
IMAGE |
PORT |
|---|---|---|
zookeeper-deployment-7ff87c7fcc-fbsfb |
confluentinc/cp-zookeeper:latest |
2181/TCP |
kafka-deployment-5c87d497b-m8s2g |
confluentinc/cp-kafka:latest |
9092/TCP |
policy-drools-pdp-0 |
nexus3.onap.org:10001/onap/policy-pdpd-cl:2.1.3-SNAPSHOT |
6969/TCP 9696/TCP |
policy-apex-pdp-0 |
nexus3.onap.org:10001/onap/policy-apex-pdp:3.1.3-SNAPSHOT |
6969/TCP |
policy-distribution-f48bff778-48pm2 |
nexus3.onap.org:10001/onap/policy-distribution:3.1.3-SNAPSHOT |
6969/TCP |
policy-models-simulator-6947667bdc-wcd9r |
nexus3.onap.org:10001/onap/policy-models-simulator:3.1.3-SNAPSHOT |
6666/TCP 6680/TCP 6668/TCP 6669/TCP 6670/TCP |
policy-clamp-ac-http-ppnt-7d747b5d98-wmr5n |
nexus3.onap.org:10001/onap/policy-clamp-ac-http-ppnt:7.1.3-SNAPSHOT |
8084/TCP |
policy-clamp-ac-k8s-ppnt-6bbd86bbc6-vnvx6 |
nexus3.onap.org:10001/onap/policy-clamp-ac-k8s-ppnt:7.1.3-SNAPSHOT |
8083/TCP |
policy-clamp-ac-pf-ppnt-5fcbbcdb6c-k2cbk |
nexus3.onap.org:10001/onap/policy-clamp-ac-pf-ppnt:7.1.3-SNAPSHOT |
6969/TCP |
policy-clamp-ac-sim-ppnt-97f487577-m2zjr |
nexus3.onap.org:10001/onap/policy-clamp-ac-sim-ppnt:7.1.3-SNAPSHOT |
6969/TCP |
policy-clamp-runtime-acm-66b5d6b64-l6dpq |
nexus3.onap.org:10001/onap/policy-clamp-runtime-acm:7.1.3-SNAPSHOT |
6969/TCP |
mariadb-galera-0 |
docker.io/bitnami/mariadb-galera:10.5.8 |
3306/TCP |
prometheus-f66f97b6-kkmpq |
nexus3.onap.org:10001/prom/prometheus:latest |
9090/TCP |
policy-api-7f7d995b4-2zhnw |
nexus3.onap.org:10001/onap/policy-api:3.1.3-SNAPSHOT |
6969/TCP |
policy-pap-f7899d4cd-mfrtp |
nexus3.onap.org:10001/onap/policy-pap:3.1.3-SNAPSHOT |
6969/TCP |
policy-xacml-pdp-6c86f85ff6-6qzgf |
nexus3.onap.org:10001/onap/policy-xacml-pdp:3.1.2 |
6969/TCP |
Note
There were no failures during the 24 hours test.
The XACML PDP offered very good performance with JMeter for the traffic mix described above. The average transaction time is insignificant.
Performance Test of Policy XACML PDP
Introduction
Performance test of acm components has the goal of testing the min/avg/max processing time and rest call throughput for all the requests with multiple requests at the same time.
Setup Details
We can setup the environment and execute the tests like this from the xacml-pdp/testsuites directory
Test Plan
Performance test plan is the same as the stability test plan above except for the few differences listed below.
Increase the number of threads up to 10 (simulating 10 users’ behaviours at the same time).
Reduce the test time to 20 minutes.
The performance tests runs the following, all in parallel:
Healthcheck, 10 simultaneous threads
Decisions, 10 simultaneous threads, each running the following in sequence:
Monitoring Decision
Monitoring Decision, abbreviated
Naming Decision
Optimization Decision
Default Guard Decision (always “Permit”)
Frequency Limiter Guard Decision
Min/Max Guard Decision
When the script starts up, it uses policy-api to create, and policy-pap to deploy the policies that are needed by the test. It assumes that the “naming” policy has already been created and deployed. Once the test completes, it undeploys and deletes the policies that it previously created.
Run Test
The code in the setup section also serves to run the tests. Just one execution needed to do it all.
bash run-s3p-test.sh run performance
Once the test execution is completed, the results are present in the automate-performance/s3pTestResults.jtl file and in /tmp/ directory.
This file can be imported into the Jmeter GUI for visualization. The below results are tabulated from the GUI.
Test Results
Summary
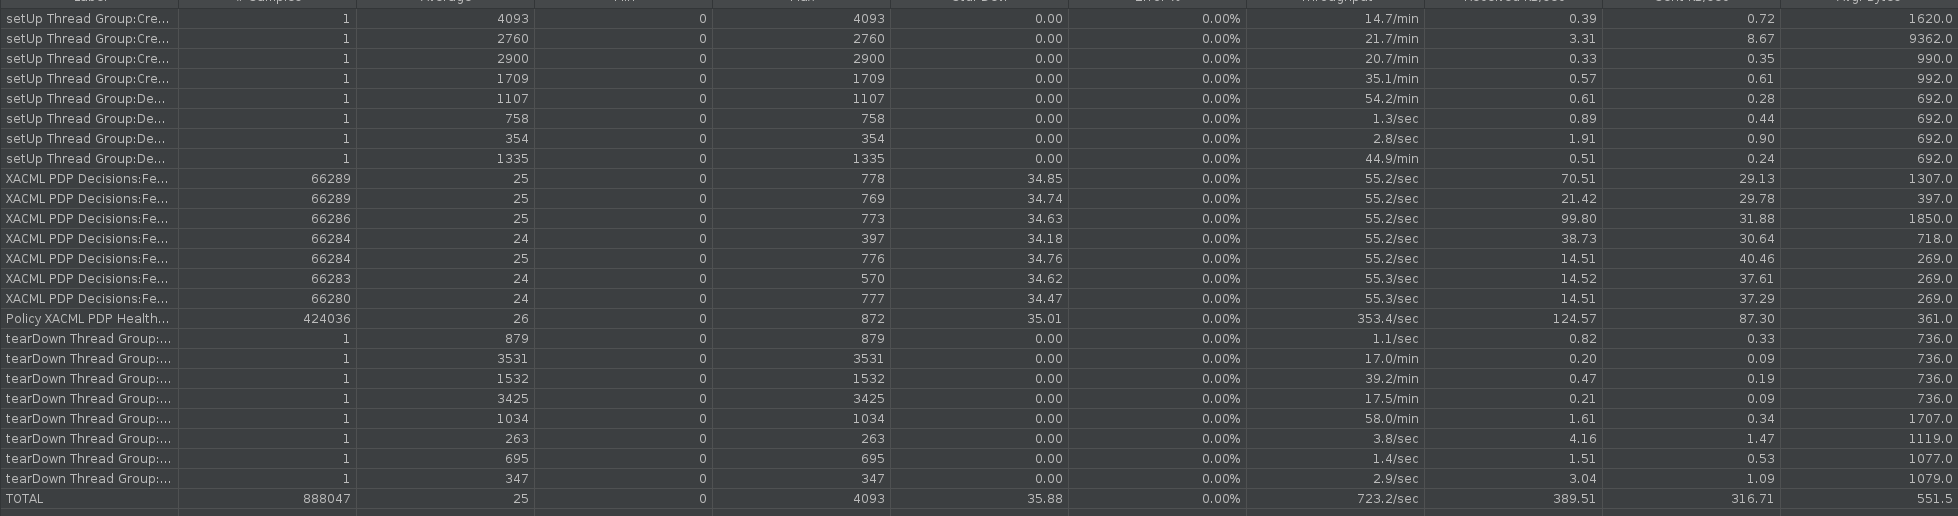
The test was run for 20 minutes with 10 users (i.e., threads), with the following results:
Test Statistics
Total # of requests |
Error % |
Average Latency (ms) |
Measured requests/sec |
|---|---|---|---|
888047 |
0.00 % |
25 ms |
723.2 ms |